Cashflow: a complete walkthrough
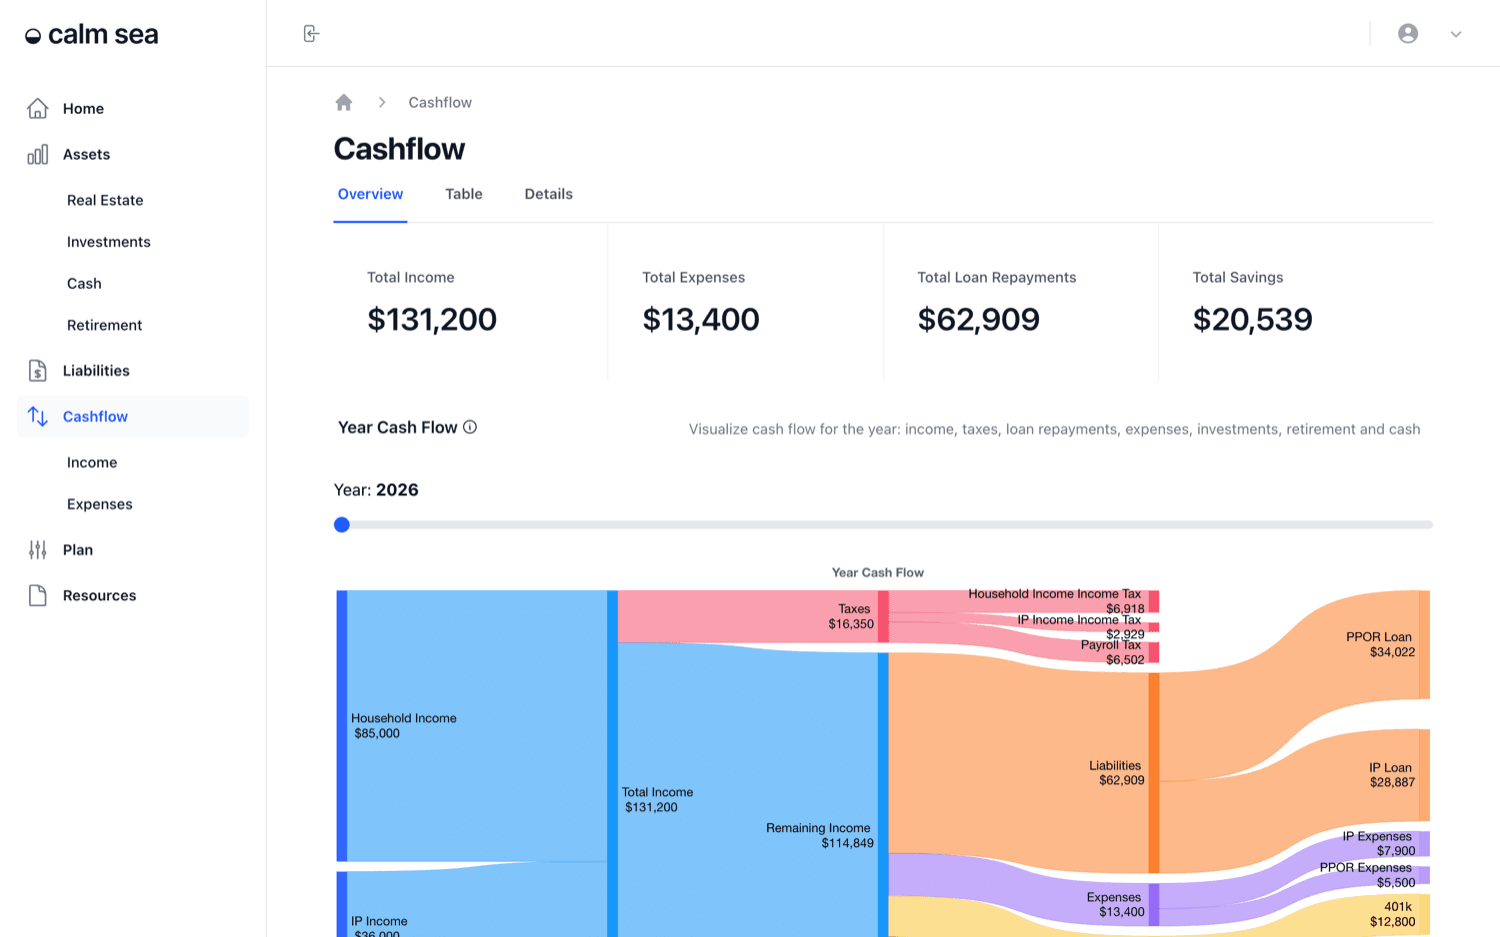
The Cashflow section shows where your money goes each year. It pulls together your income, taxes, expenses, loan repayments and contributions, then shows what's left over as savings, for this year and every year of your projection.
What you'll be able to do: By the end of this guide, you'll know how to read your yearly cashflow, follow it through the cash flow diagram, compare years in the table, and choose where surplus cash goes.
Reading the summary cards
Total Income - everything coming in this year, including employer contributions.
Total Expenses - your living costs and property costs.
Total Loan Repayments - what you repay across all loans.
Total Savings - what's left after taxes, expenses, repayments and contributions.
Following the year cash flow diagram
The Year Cash Flow diagram traces every dollar from left to right. Income sources on the left join into total income. Taxes split off, and what remains is divided between loan repayments, expenses, retirement contributions, investments and cash.
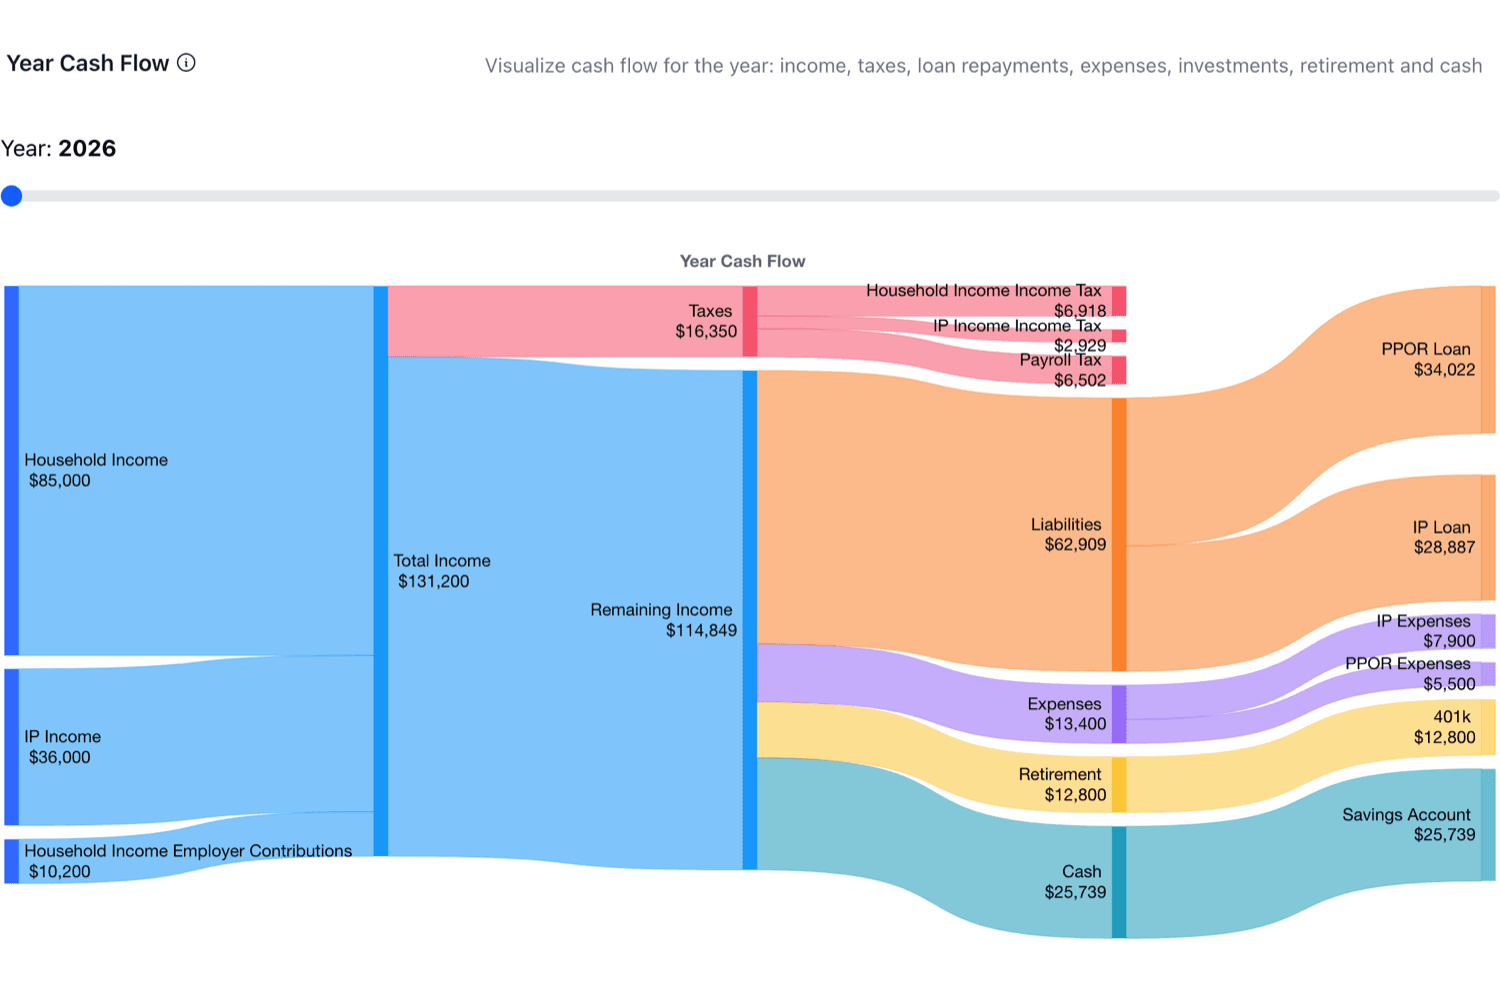
Drag the Year slider to see the same diagram for a future year, for example the year after you retire or the year a loan is paid off. If you're new to this kind of chart, the Sankey diagram guide explains how to read one.
Using the Cashflow Summary
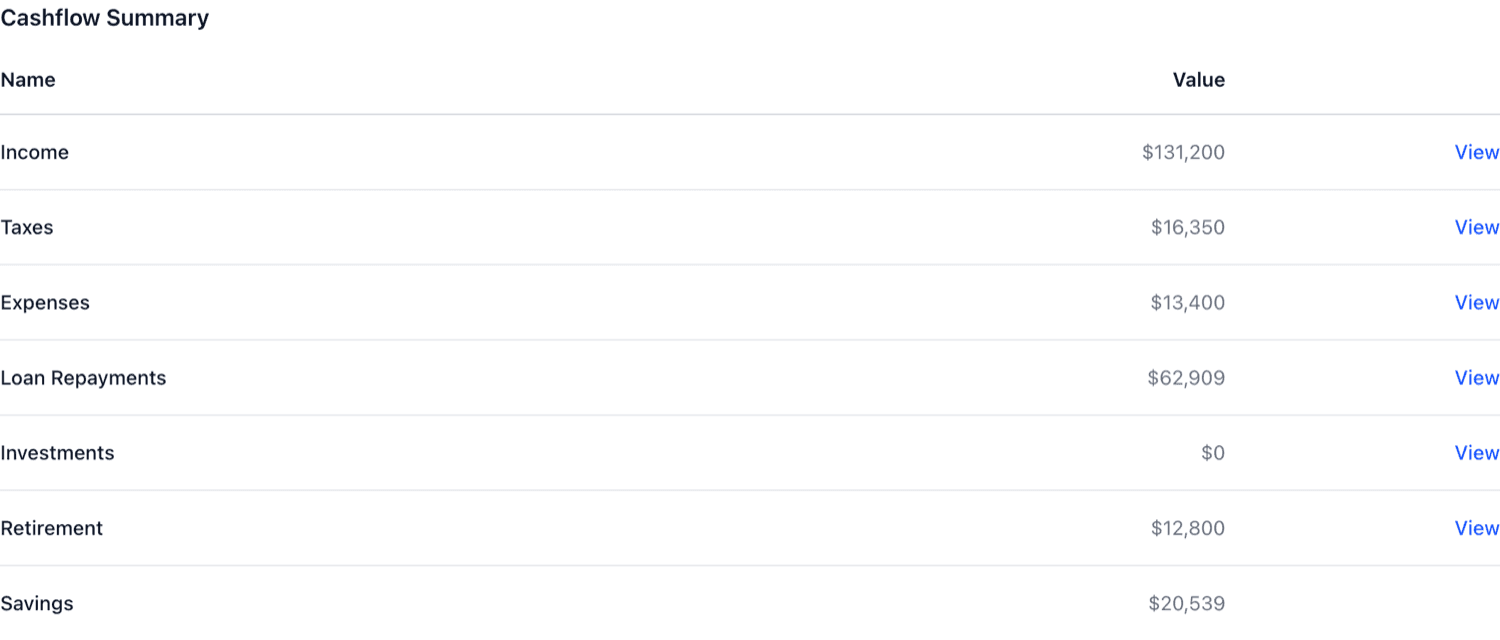
Under the diagram, the Cashflow Summary lists each part of the year's cashflow: income, taxes, expenses, loan repayments, investments, retirement and savings. View links take you to the page where each one is managed.
Comparing years in the Table tab
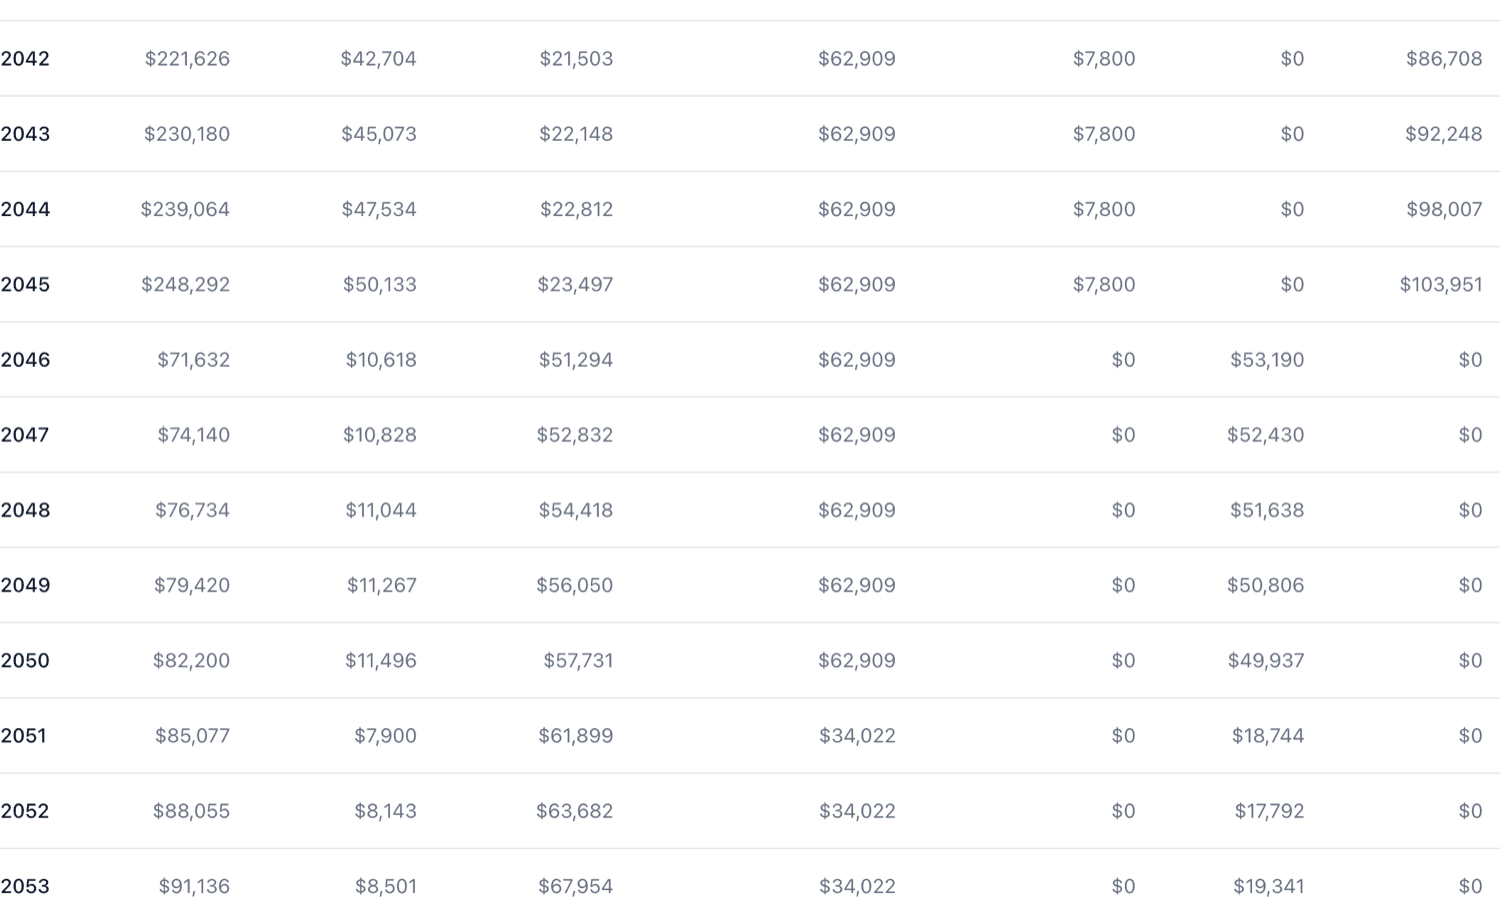
The Table tab has one row per year with total income, taxes, expenses, loan repayments, contributions, withdrawals and savings. It's the quickest way to spot years when spending jumps or income drops, such as the first year of retirement.
Checking the tax breakdown
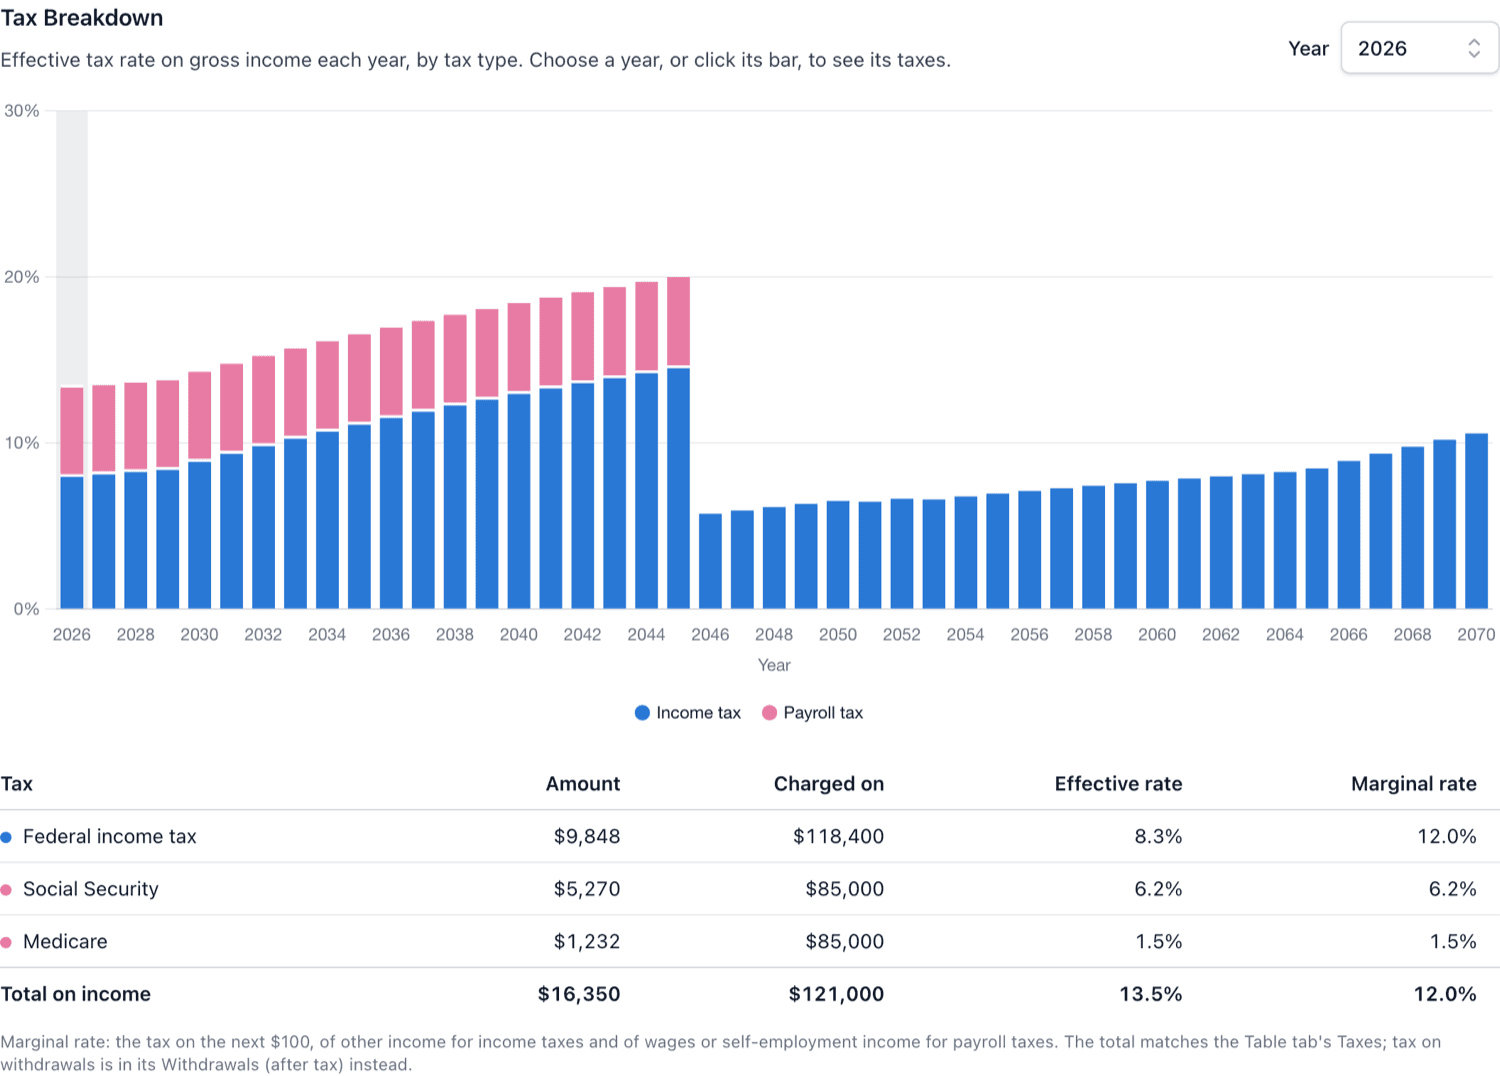
The Details tab starts with a Tax Breakdown estimates for a chosen year: each tax type, the amount, the income it's charged on, and its effective and marginal rate. Choose a year from the list, or click its bar in the chart. The taxes shown depend on the tax settings described in the Income guide. The marginal tax rate guide explains the difference between the two rates.
Choosing where surplus cash goes
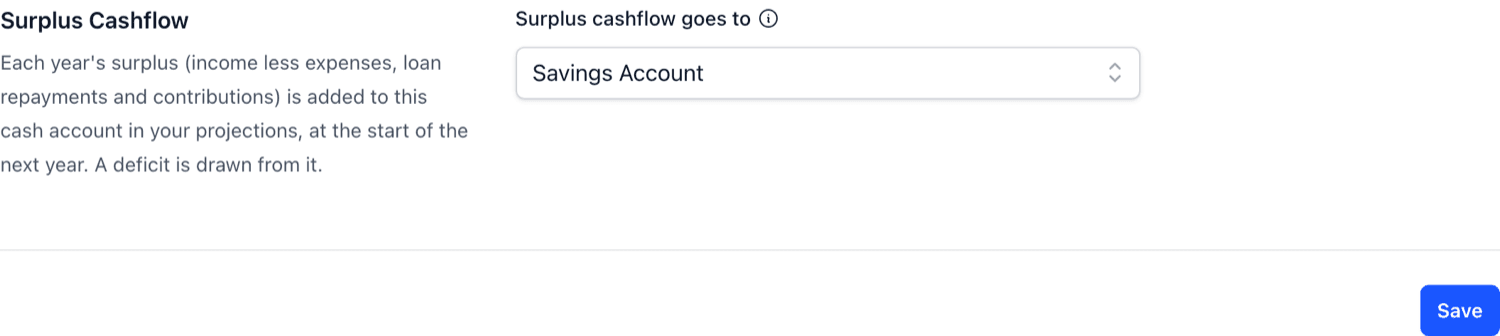
Also on the Details tab, Surplus Cashflow sets the cash account that receives each year's surplus. Surplus is added to that account at the start of the next year, and a deficit is drawn from it. Pick the savings account you'd really use.
Like the other dashboards, Cashflow has Forecast Options to show future years in today's dollars. For the bigger picture of how surplus cash builds your net worth over time, see the Plan guide.