Income: a complete walkthrough
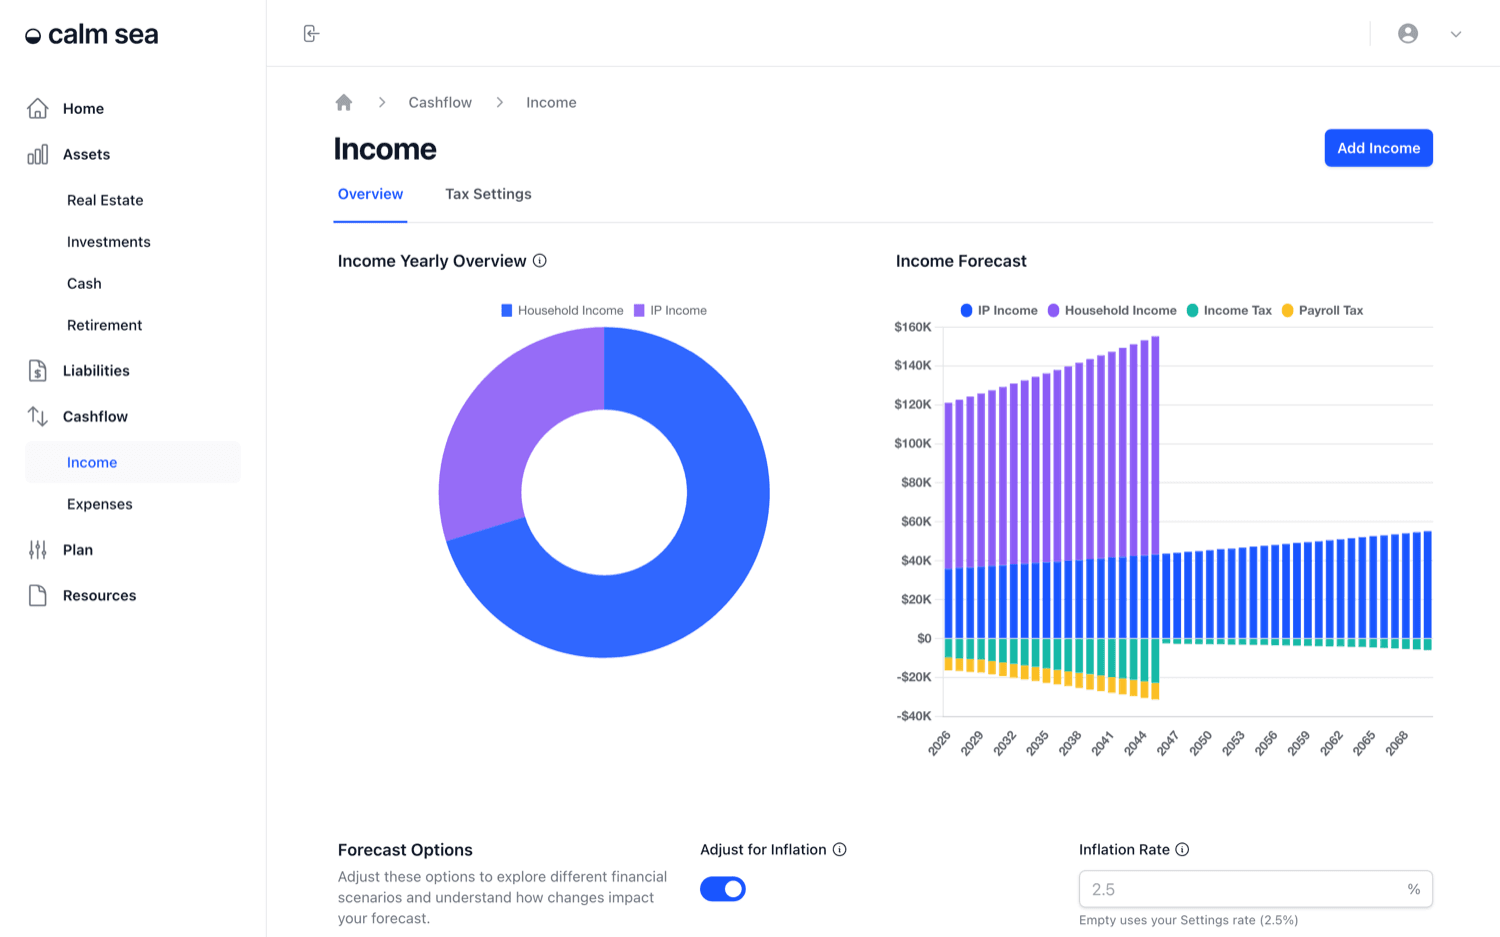
The Income page holds every source of money coming in: salaries, business income, rent and anything else you're paid. Each income has a growth rate, a start and an end, and a tax treatment, so your projections know what you'll earn in every future year.
What you'll be able to do: By the end of this guide, you'll know how to read your income forecast, add an income that stops when you retire, check your tax settings, and see how much of an income reaches you after tax.
Finding the Income page
Open Income under Cashflow in the sidebar. The page has two tabs, Overview and Tax Settings.
Reading the income charts
Income Yearly Overview is a doughnut chart of this year's income by source. Income Forecast projects each income year by year. You'll see each one grow at its own rate and stop in the year it ends, for example when a salary stops at retirement. Forecast Options under the charts shows the forecast in today's dollars.
Using the Total Income table
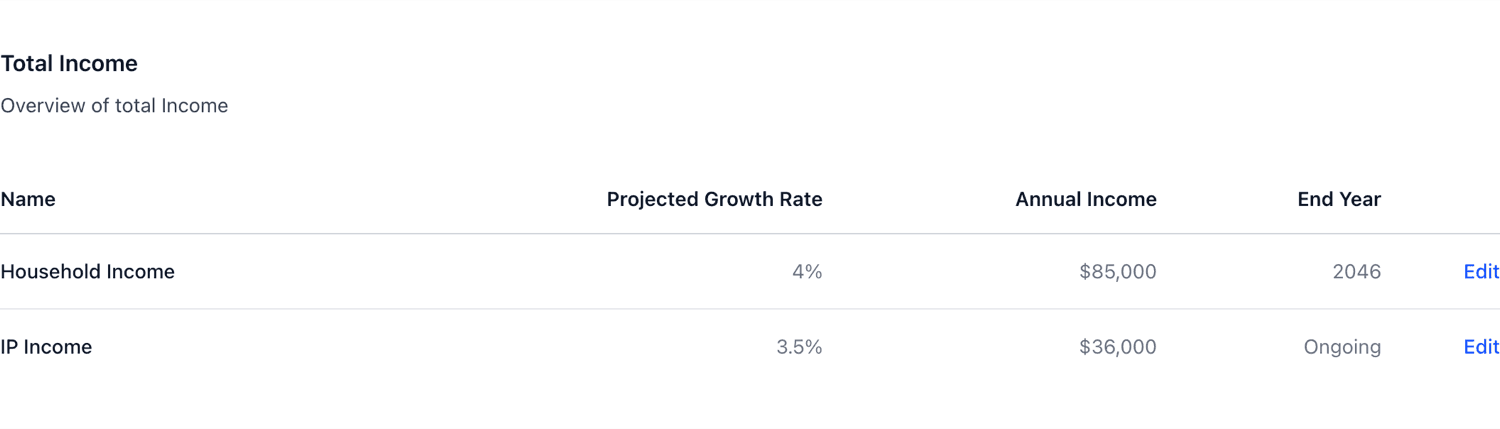
The table lists each income with its projected growth rate, annual amount and end year. "Ongoing" means it runs for the whole projection. Click Edit to open one.
Adding an income
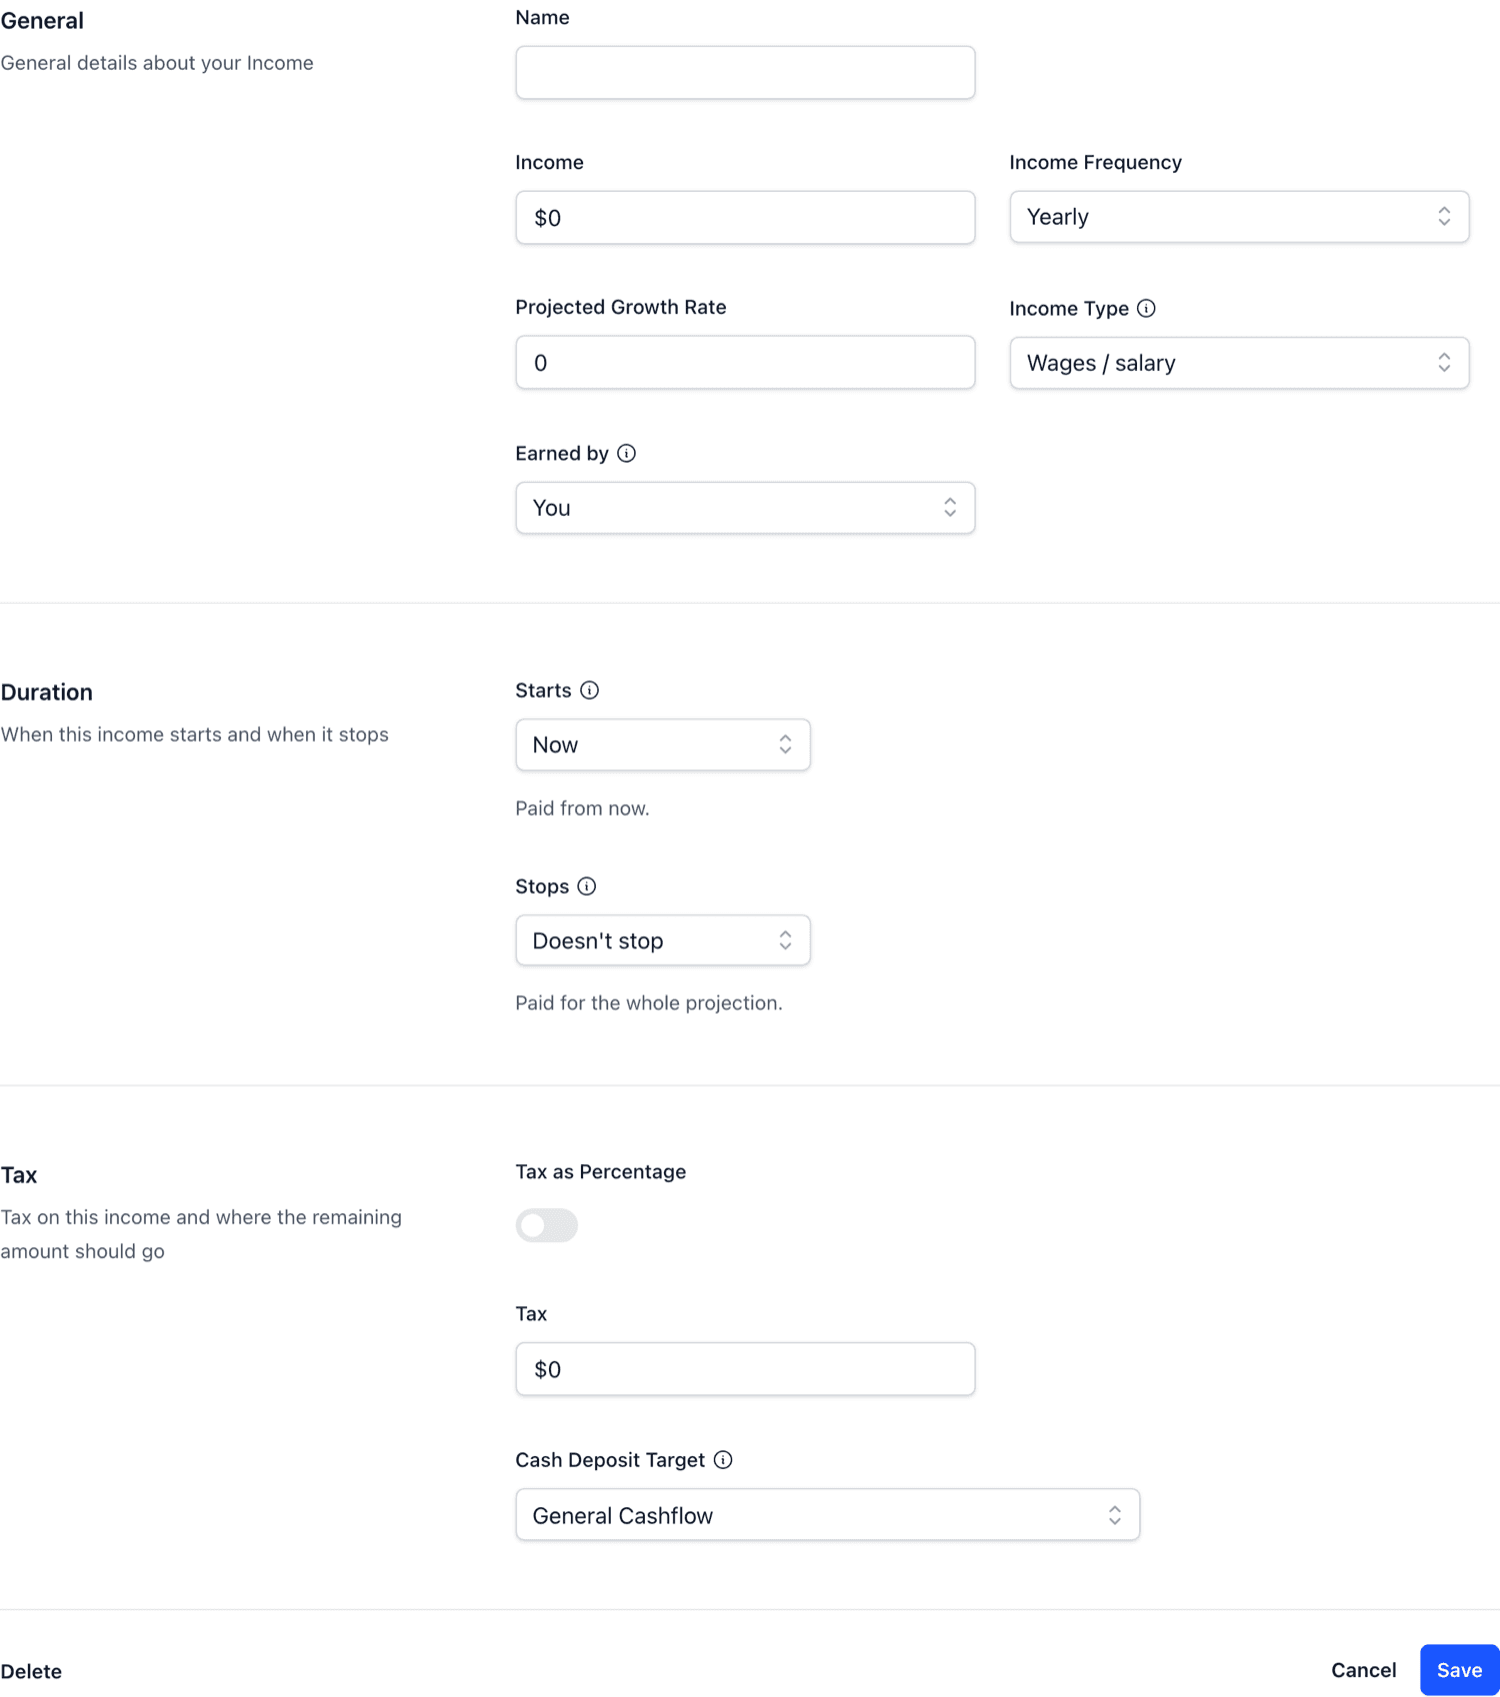
Use Add Income at the top of the page. The form has three sections.
General - the Name, the Income amount and how often it's paid, a Projected Growth Rate, the Income Type (such as wages or salary) and who it's Earned by when you're planning as a couple.
Duration - when the income Starts and Stops. It can start now, and it can run for the whole projection or stop when you retire. Linking it to retirement means it moves automatically if you change your retirement age.
Tax - how tax is worked out for this income, and the Cash Deposit Target: where the money left after tax goes. Leave it on General Cashflow unless the income is paid straight into a particular account.
Seeing gross to net
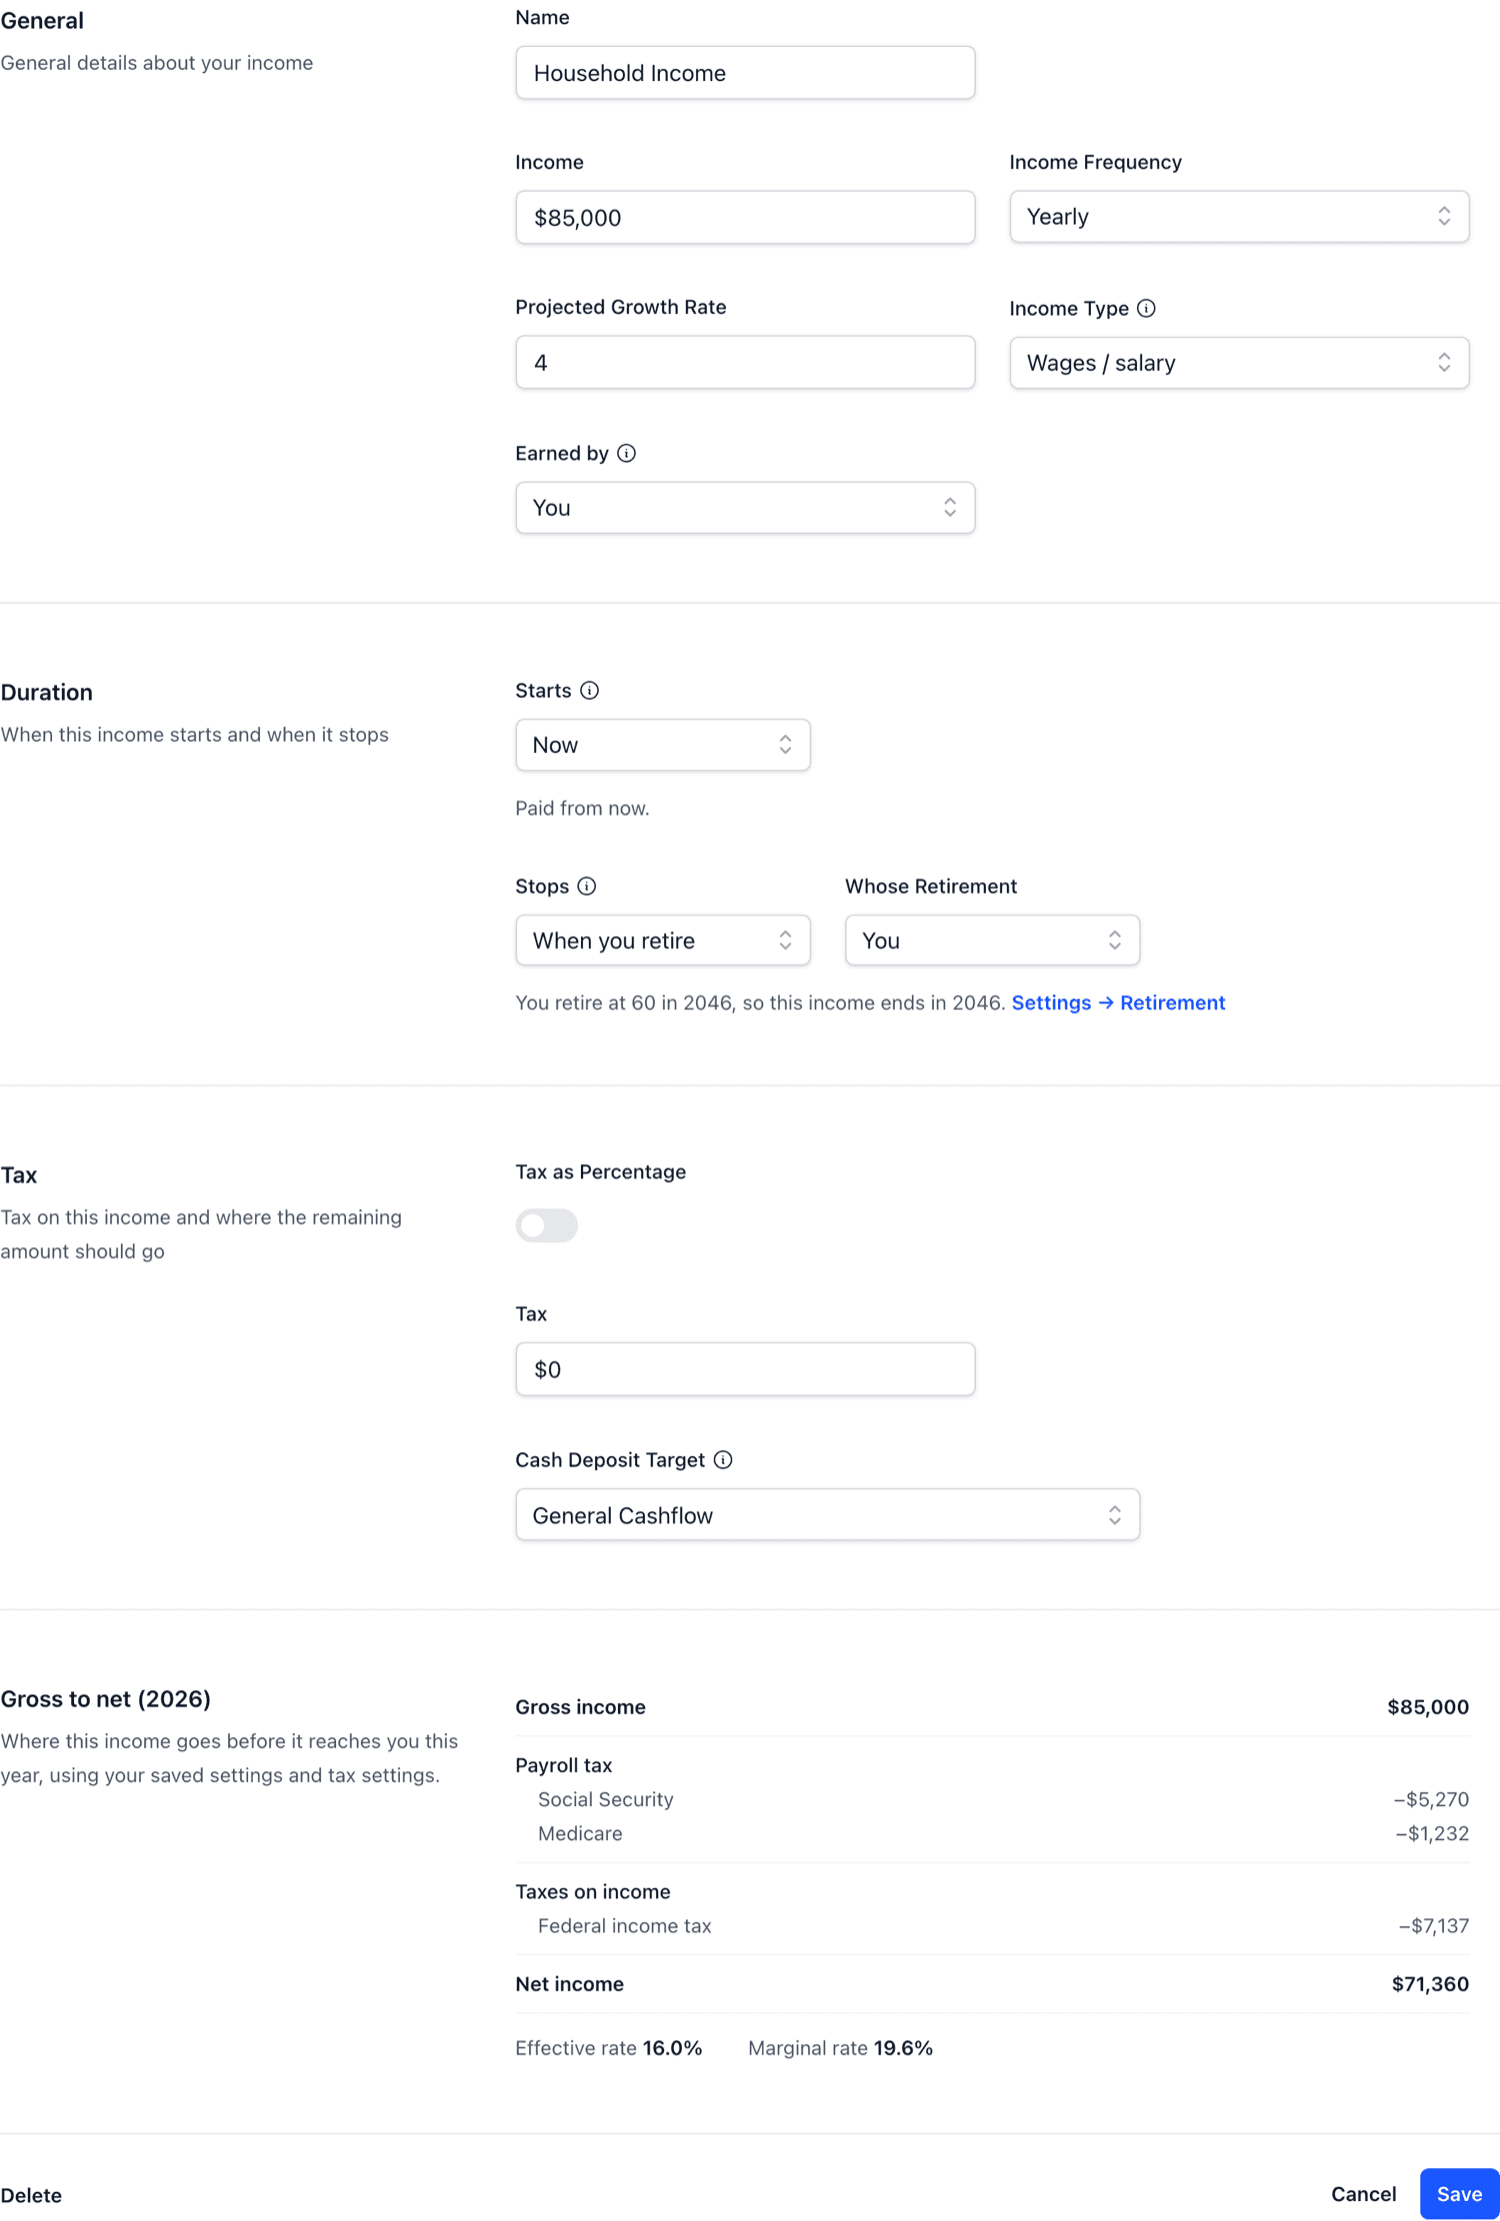
Open an existing income to see the same form with a Gross to net summary at the bottom. It starts with the gross amount, takes off each estimated tax for the current year, and shows the net income that reaches you, with your effective and marginal tax rate on it. The income tax guide explains how those two rates differ.
Checking your tax settings
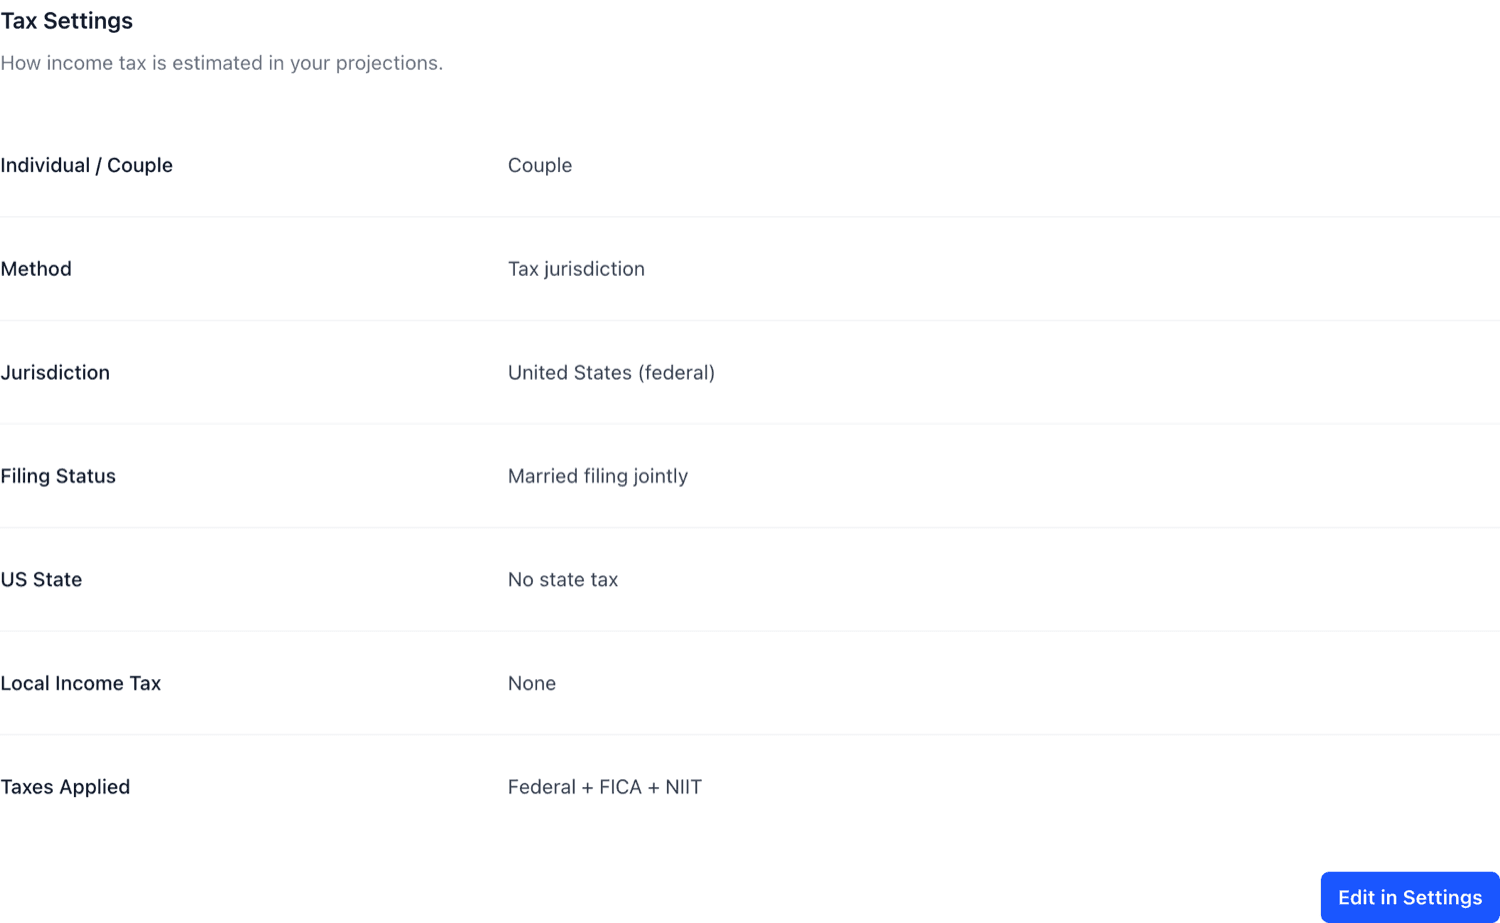
The Tax Settings tab shows how income tax is estimated in your projections: whether you're planning as an individual or a couple, the tax method, your tax jurisdiction and its options, and which taxes are applied. Click Edit in Settings to change them. They apply to every income in your projections.
If you'd rather enter tax yourself, turn on Tax as Percentage on an income, or enter a fixed Tax amount for it.
Your income feeds straight into the Cashflow page, where you can follow each income through taxes, repayments, expenses and savings. Salaries can also drive retirement contributions, as covered in the Retirement Accounts guide.