Expenses: a complete walkthrough
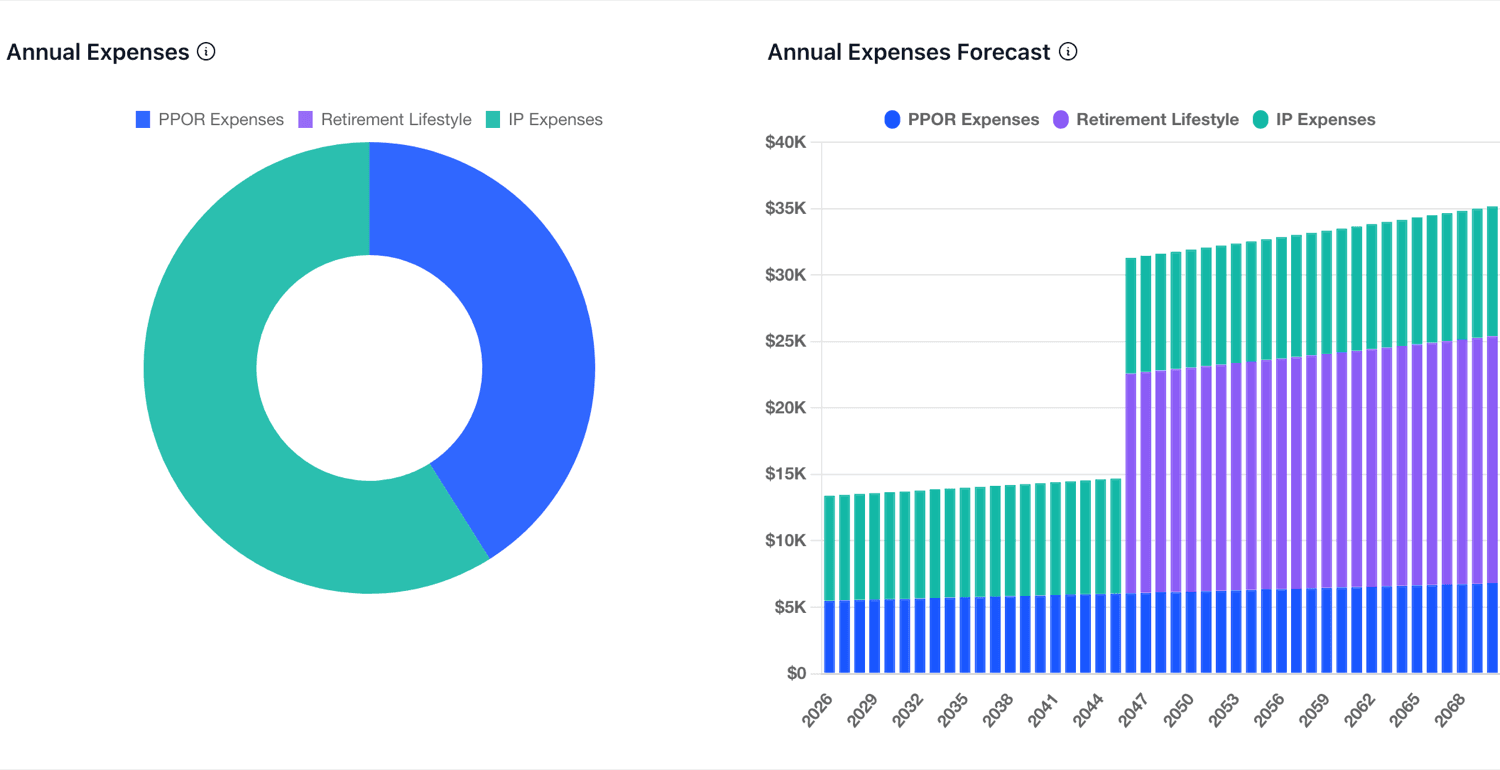
The Expenses page holds what you spend: living costs, property costs and the spending you expect once you retire. Expenses are entered as groups of items, each with its own growth rate and timing, so your projections reflect how spending changes over your life.
What you'll be able to do: By the end of this guide, you'll know how to read your expense forecast, group costs into an expense, link property costs to a property, and set expenses that start or stop at retirement.
Finding the Expenses page
Open Expenses under Cashflow in the sidebar.
Reading the expense charts
Annual Expenses is a doughnut chart of this year's spending by expense group. Annual Expenses Forecast projects each group year by year, growing at its projected rate and starting or stopping in the years you set. Forecast Options shows the forecast in today's dollars, which makes it easier to see whether your spending really rises or just keeps pace with inflation.
Using the Total Expenses table
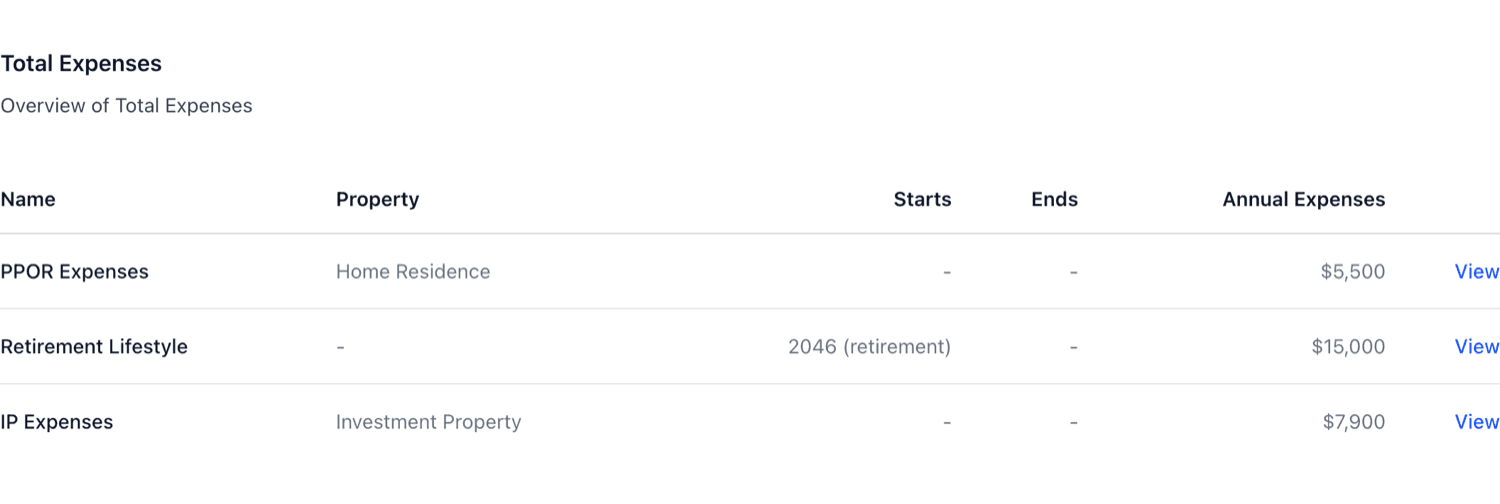
The table lists each expense group with the property it's linked to, when it starts and ends, and its annual cost. Click View to open a group.
Below your own expenses, a Calculated table can list costs the projection works out for you, so you don't need to enter them. Change them where their input lives, which the table links to. Calm Sea may also suggest an expense you haven't added yet. Choose Add expense to include it, or Not now to dismiss it.
Adding an expense group
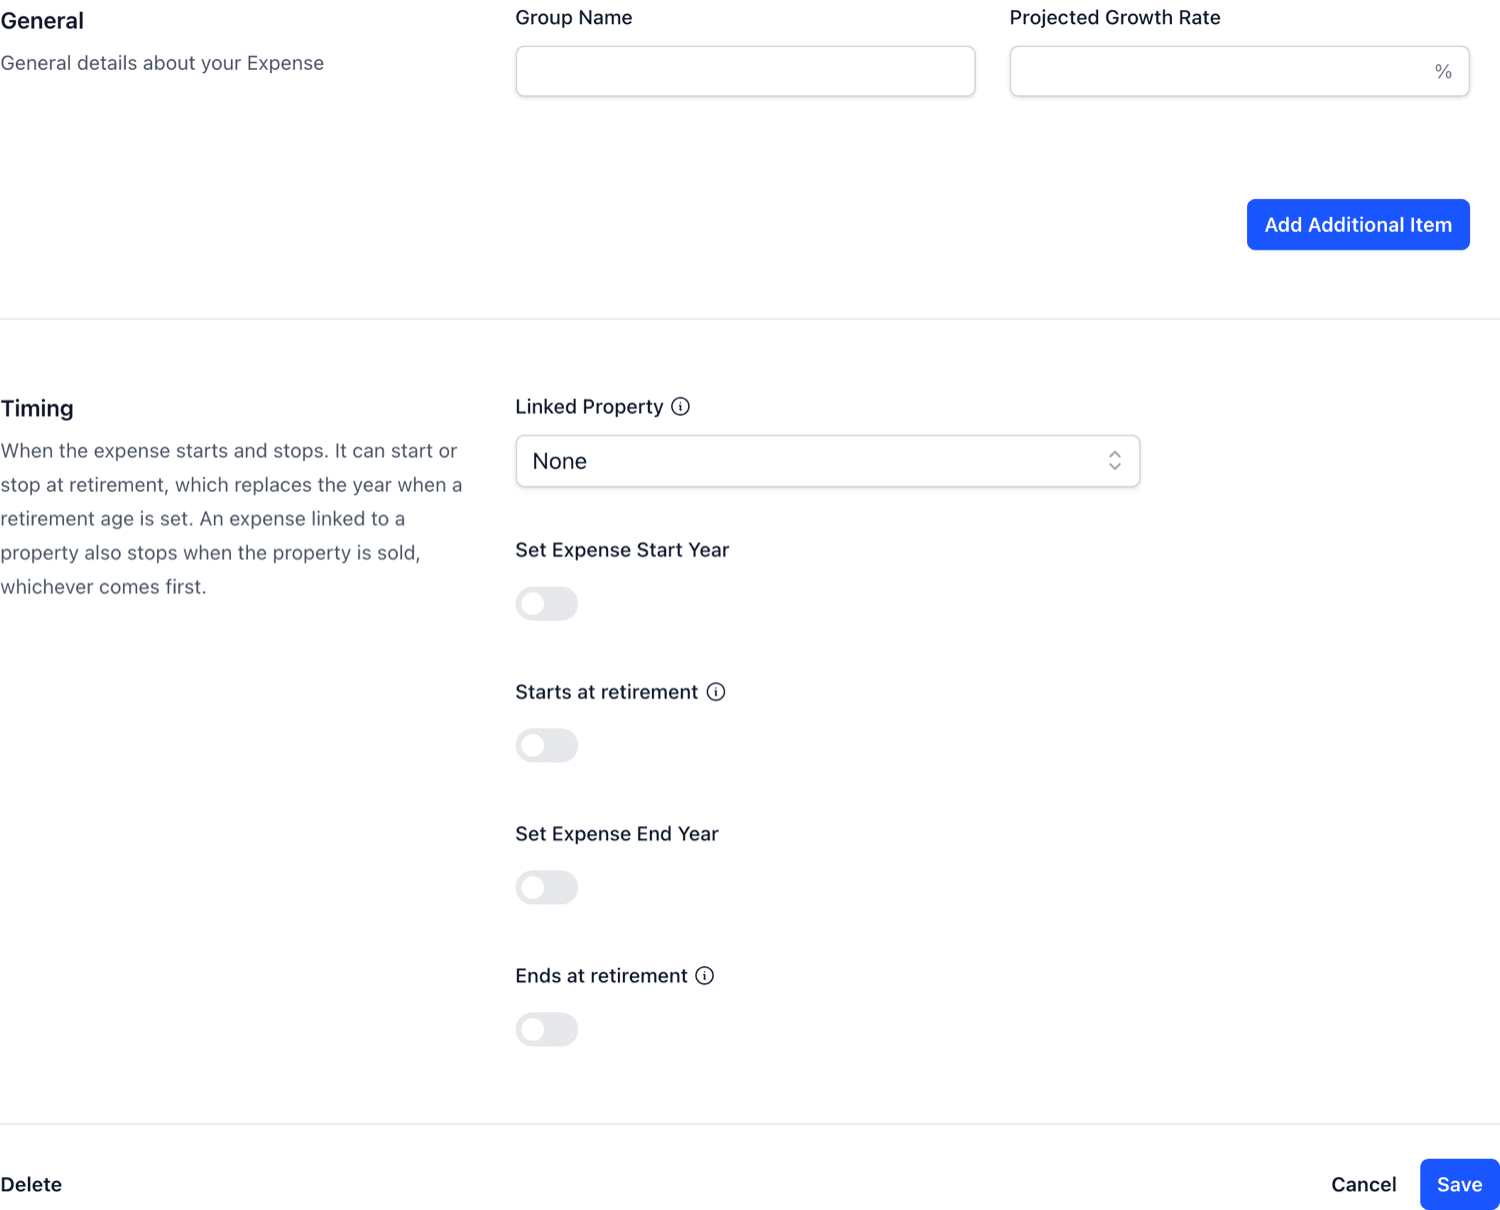
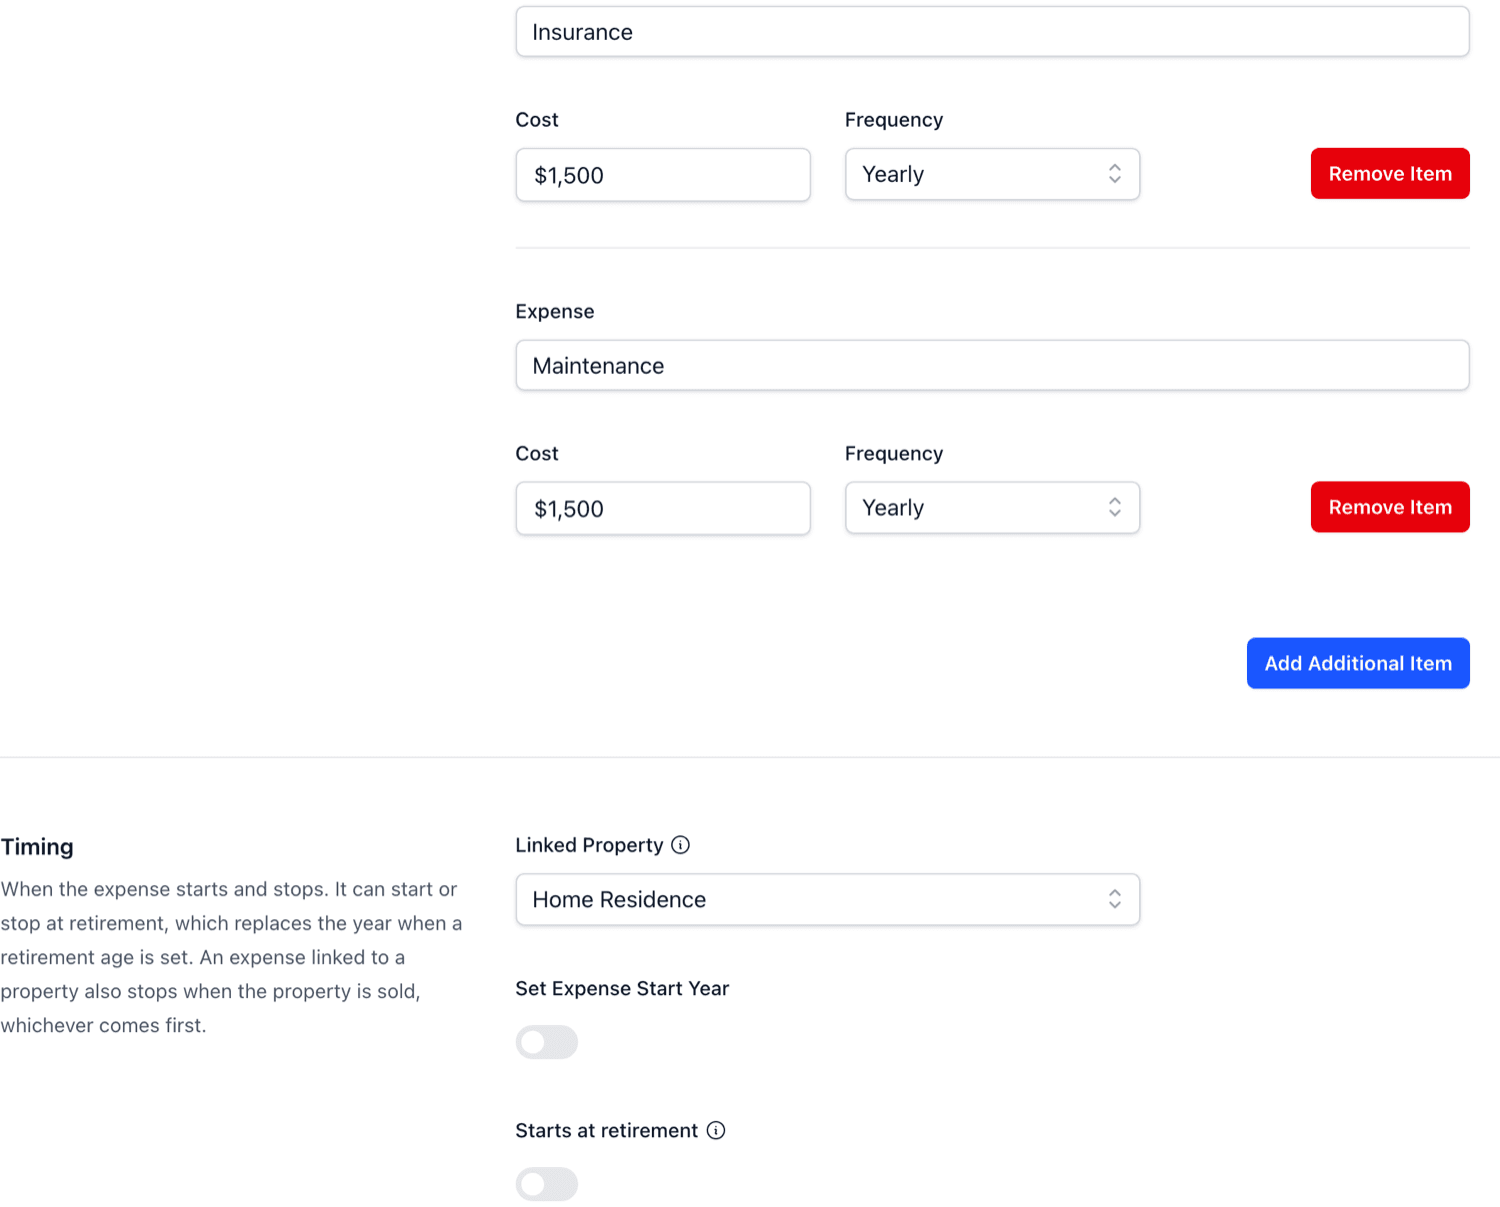
Use Add Expense at the top of the page. Give the group a Group Name and a Projected Growth Rate, then add each cost as an item with its amount and frequency. Add Additional Item adds another line. Grouping related costs, such as everything for one property or everything for groceries and household bills, keeps the charts readable.
Timing an expense around retirement or a property
The Timing section decides when the expense applies:
Linked Property - ties the expense to a property. It then appears on that property's cashflow and stops when the property is sold.
Start Year - a set year, or Starts at retirement for spending that only begins once you stop work, such as travel.
End Year - a set year, or Ends at retirement for costs that stop when you do, such as commuting.
When an expense is linked to a property and has an end year, it stops at whichever comes first. A note under the fields tells you what will happen.
Viewing one expense group
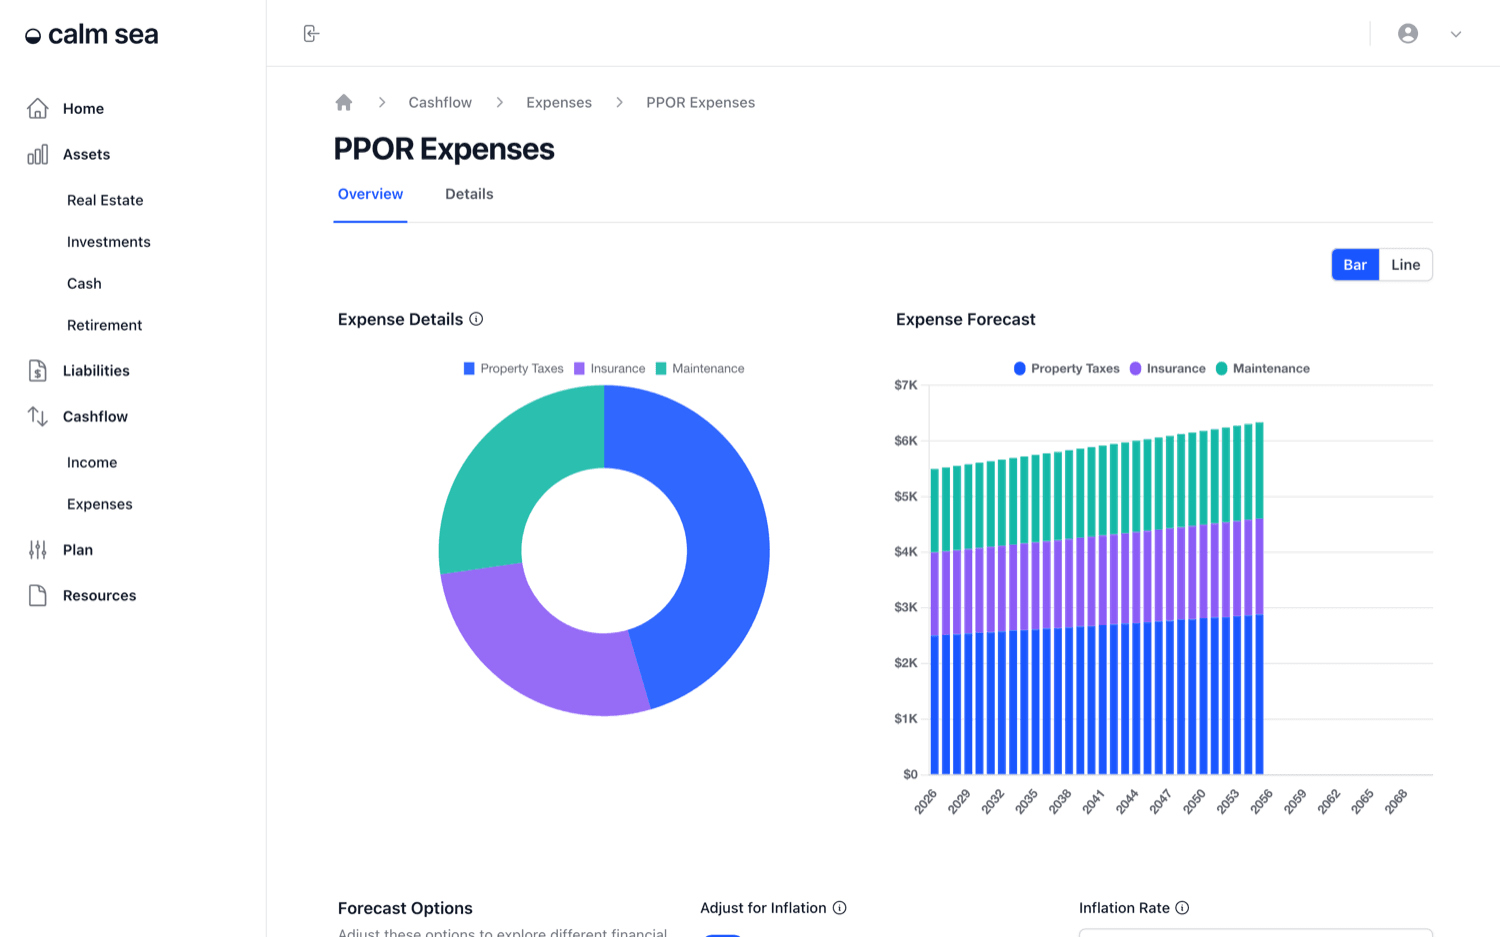
An expense group's Overview tab charts its items for the year and their forecast over time, with the same Bar and Line toggle and Forecast Options as the other pages.
Expenses flow into the Cashflow page, and spending in retirement is what the Plan tests your savings against. The 50/30/20 budget rule is one simple way to sanity-check your spending.