Plan: a complete walkthrough
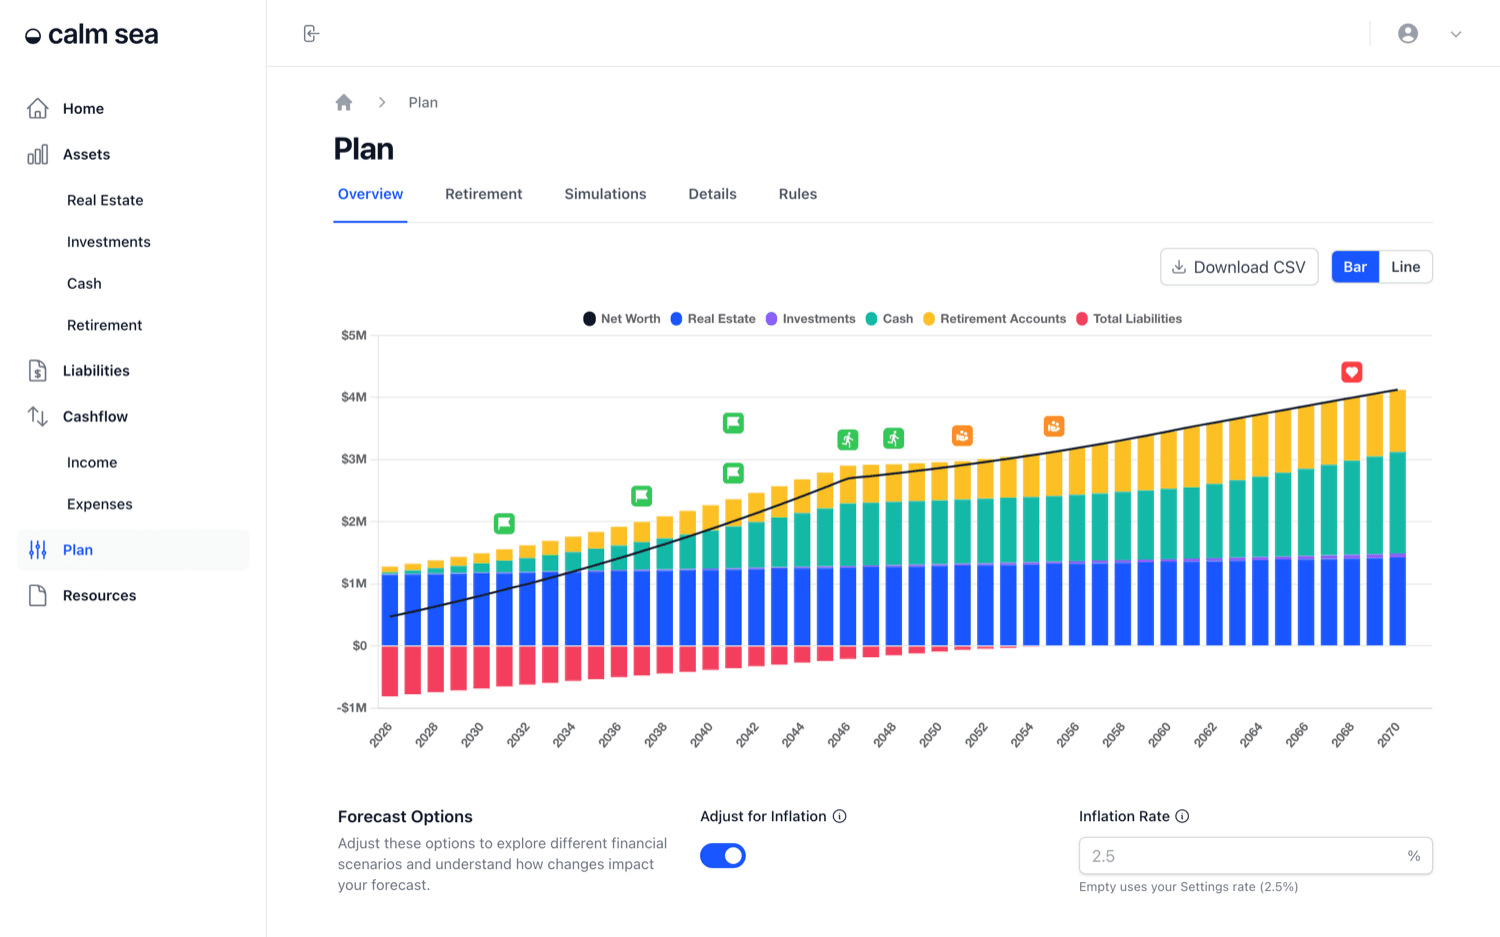
The Plan page brings everything together. It projects your whole net worth year by year, marks the life events that change it, estimates whether your money lasts through retirement, and tests that estimate against thousands of possible market outcomes.
What you'll be able to do: By the end of this guide, you'll know how to read your net worth projection, add events, compare retirement ages, read your chance of success, and set the order your savings are drawn down in retirement.
Finding the Plan page
Open Plan in the sidebar. It has five tabs: Overview, Retirement, Simulations, Details and Rules.
Reading the net worth projection
The Overview chart stacks every asset type, real estate, investments, cash and retirement accounts, above the line, and total liabilities below it. The black line is your net worth, assets minus liabilities. Switch between Bar and Line, and use Download CSV to take the yearly figures into a spreadsheet. Forecast Options shows the chart in today's dollars. The net worth tracking guide explains why the trend matters more than any single year.
Adding events
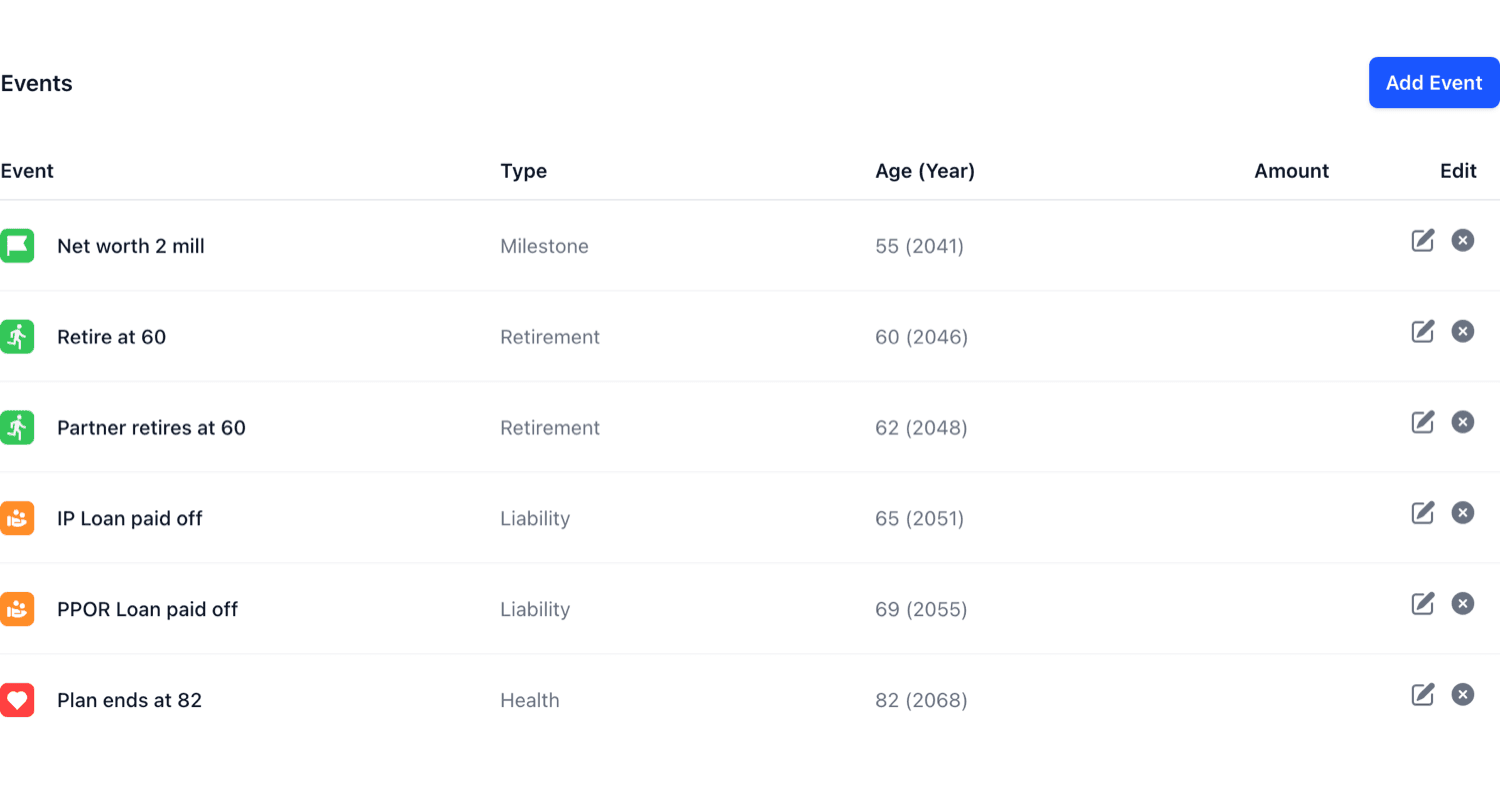
The icons on the chart are events, and the Events table below lists them. Events include each person's retirement, the year each loan is paid off and the end of the plan. Use Add Event to add your own, such as a net worth milestone.
Checking your retirement estimate
The Retirement tab answers the main question: does your money last? A summary estimates the age your money lasts until, your total assets at retirement and any unfunded gap, all in today's dollars.
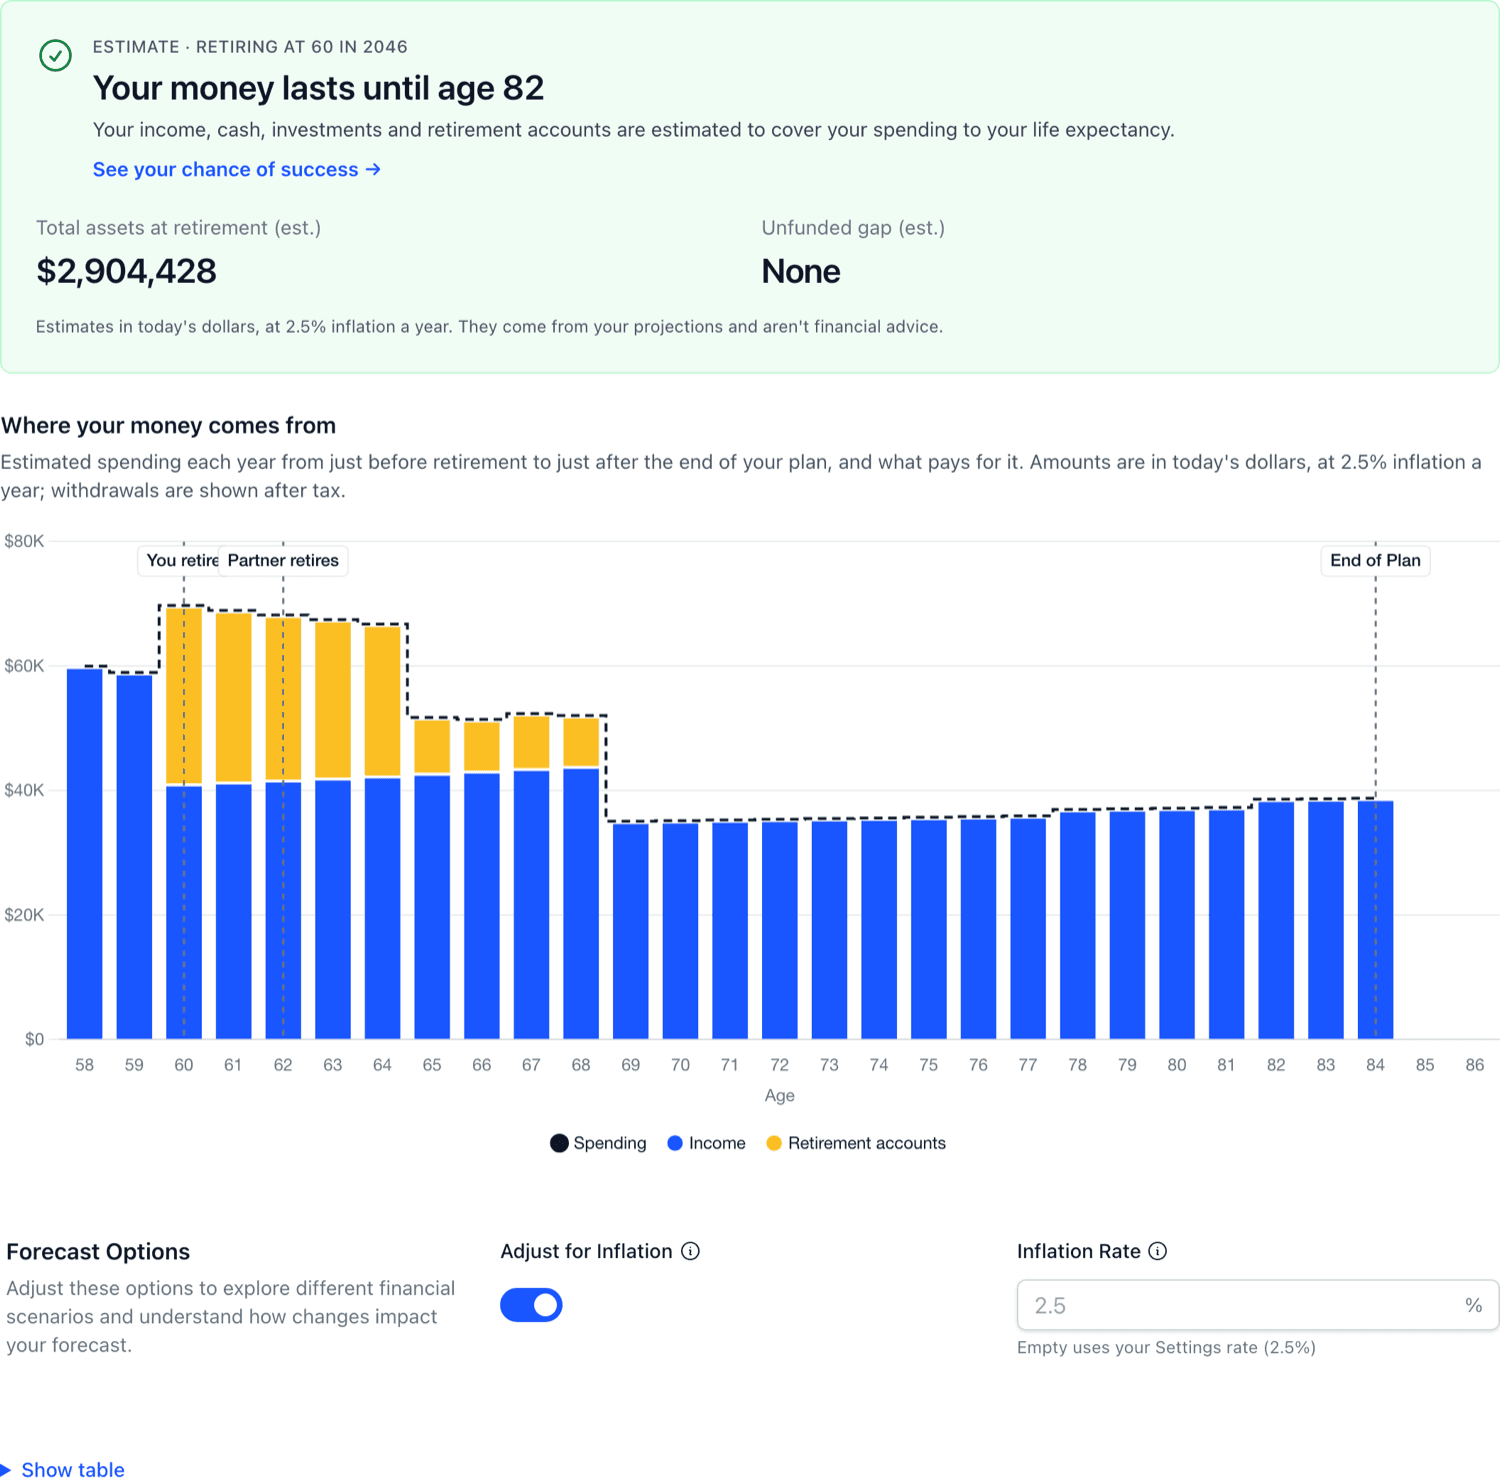
Where your money comes from charts your spending each year around and after retirement, and what pays for it: income, then withdrawals from your assets after tax. Change Retire at to try a different age. Your saved settings don't change.
Comparing retirement ages
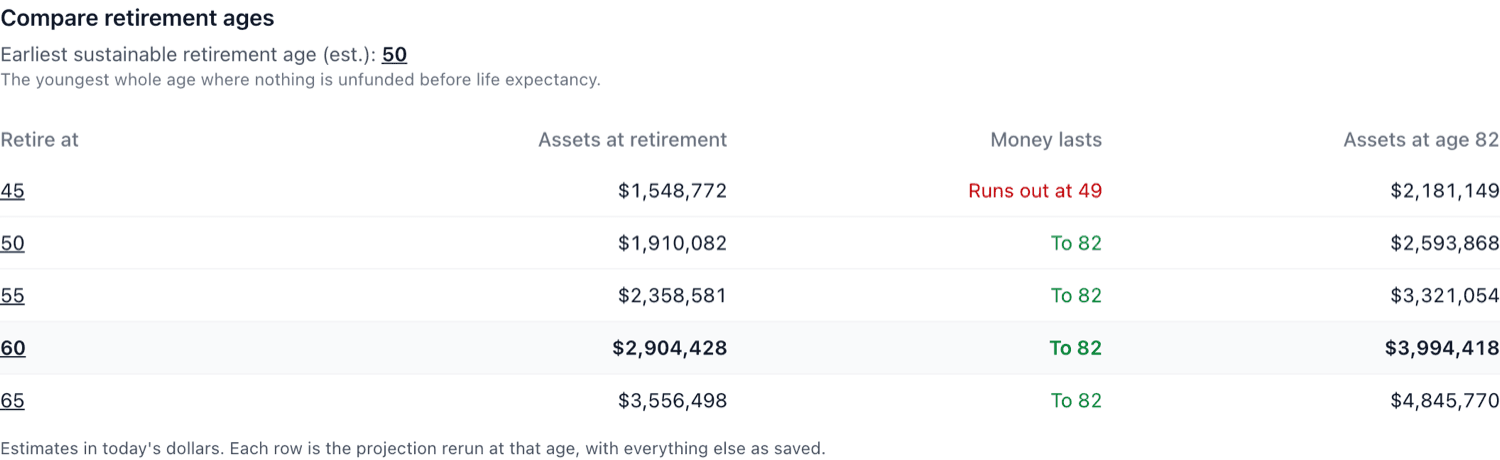
Compare retirement ages reruns your projection at several ages and shows the assets at retirement, how long the money lasts, and what's left at the end of the plan. It also shows the earliest sustainable retirement age: the youngest age where nothing is unfunded before life expectancy.
Reading the Monte Carlo simulations
The Simulations tab runs your plan many times with yearly returns that vary around each account's growth rate, then reports your chance of success: the share of runs where your money lasts to your life expectancy. The Monte Carlo calculator guide covers how this kind of simulation works.
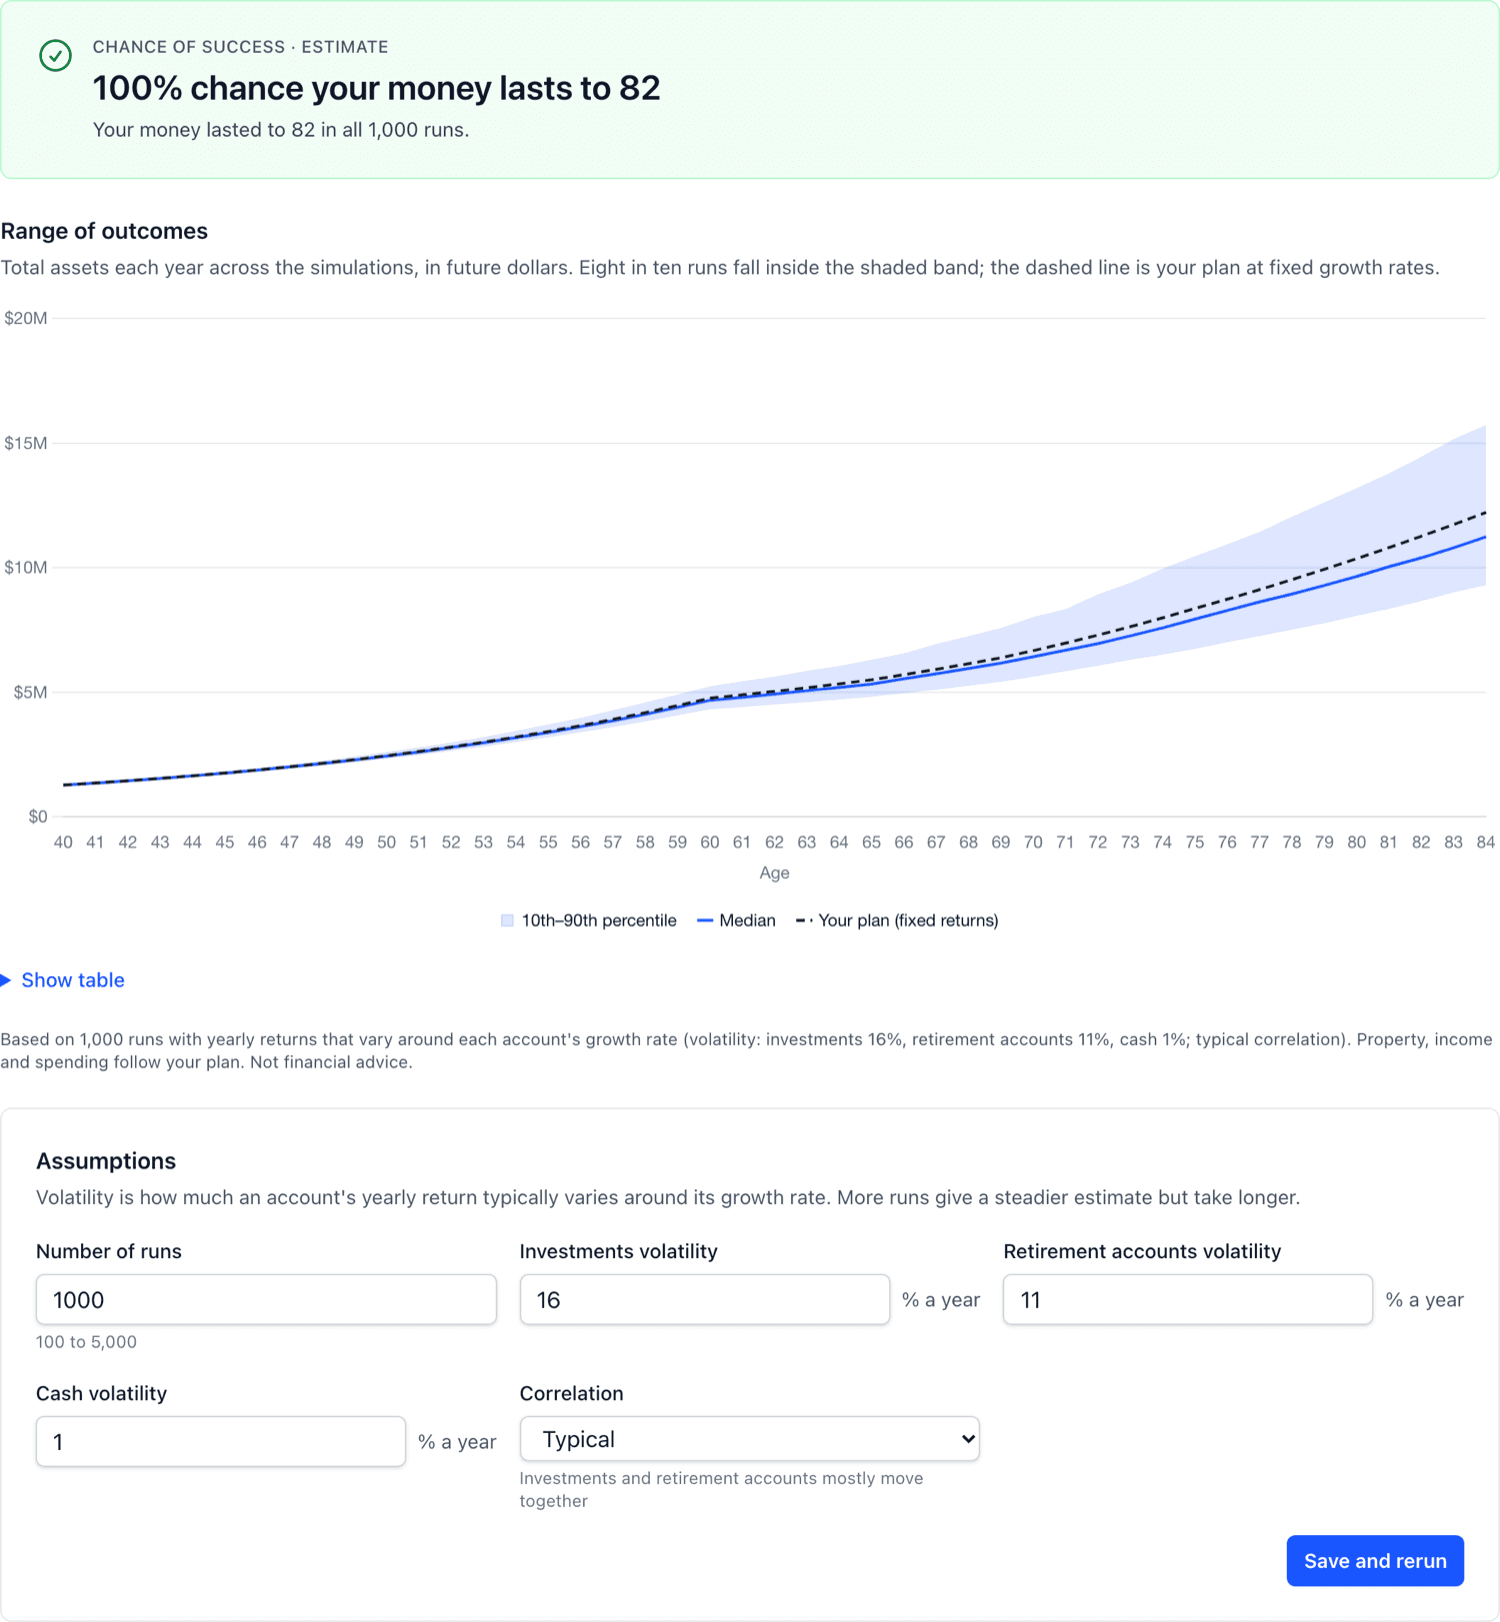
The Range of outcomes chart shows total assets across the runs. Eight in ten runs fall inside the shaded band, the solid line is the median, and the dashed line is your plan at fixed growth rates. Under Assumptions, you can set the Number of runs (100 to 5,000), the volatility of investments, retirement accounts and cash, and how closely they move together. Then choose Save and rerun.
Reviewing who and when
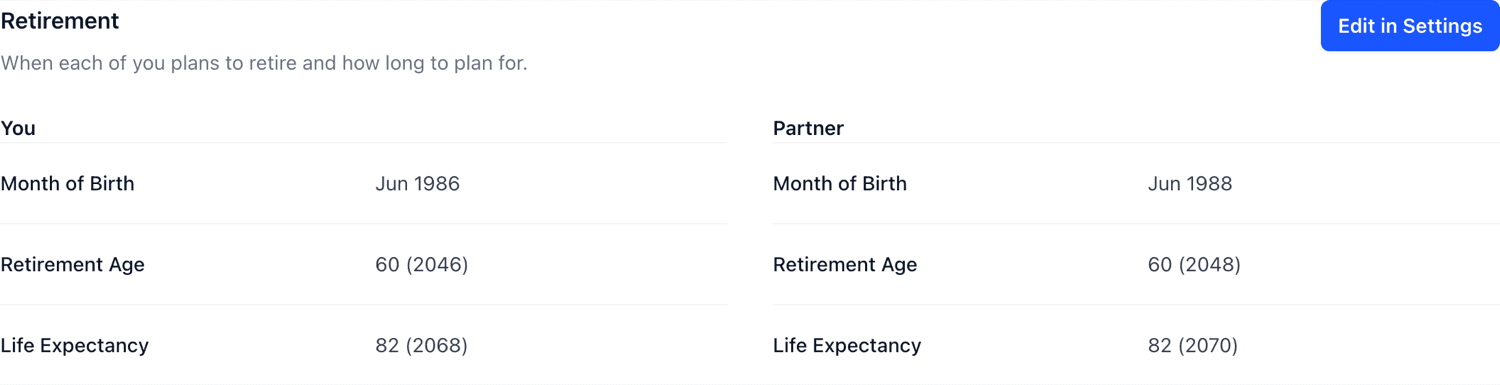
The Details tab shows each person's month of birth, retirement age and life expectancy, which set the timeline for the whole plan. Click Edit in Settings to change them.
Setting the drawdown rules
The Rules tab decides how a shortfall is paid once you retire:
Drawdown Order - the order assets are drawn from. Change the order to suit you, and tick Never draw to keep an asset, such as an emergency fund, out of the drawdown.
Early Withdrawals - retirement accounts that can normally only be drawn from a certain age are skipped until then. Turn this on to let the plan draw them early, after your other assets, and pay any early-withdrawal penalty instead of leaving a shortfall.
Cash Buffer - a minimum amount the drawdown keeps in cash, entered in today's dollars and grown with inflation.

Reset to default order puts the order back if you want to start again. The safe withdrawal rate guide covers a common rule of thumb for how much to draw each year.
All of the Plan's figures come from what you've entered in Assets, Liabilities and Cashflow, so keeping those up to date keeps your plan accurate. The estimates are a planning aid, not financial advice.