Investments: a complete walkthrough
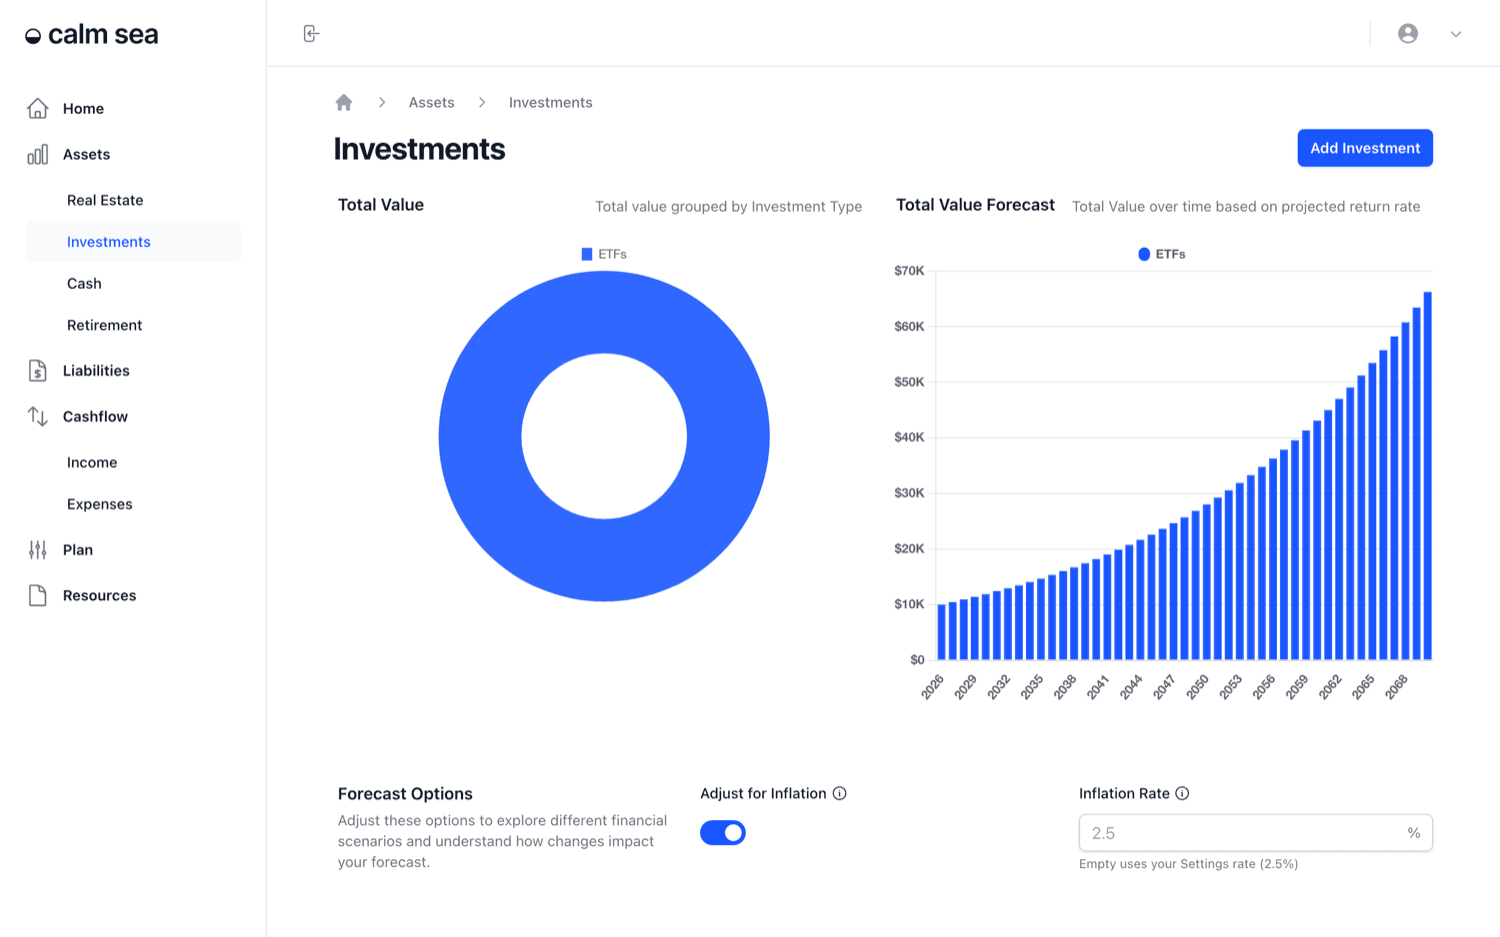
The Investments section tracks the money you hold outside retirement accounts and property: shares, ETFs, managed funds, bonds and similar holdings. It shows what they're worth now and how they could grow from returns and regular contributions.
What you'll be able to do: By the end of this guide, you'll know how to read the Investments dashboard, see what's driving an investment's future value, and add, edit or plan the sale of an investment.
Finding the Investments page
Open Investments, the second item under Assets in the sidebar.
Reading the dashboard charts
Total Value is a doughnut chart of your current investments grouped by Investment Type, so you can see at a glance how your money is split between shares, funds and other types.
Total Value Forecast projects your investments' combined value each year, stacked by investment. Each investment grows at its own projected growth rate, plus any cash contributions you've set.
Forecast Options sits under the charts. Turn on Adjust for Inflation to show the forecast in today's dollars. Leave Inflation Rate empty to use your Settings rate, or enter a different rate to test it.
Using the Total Investments table
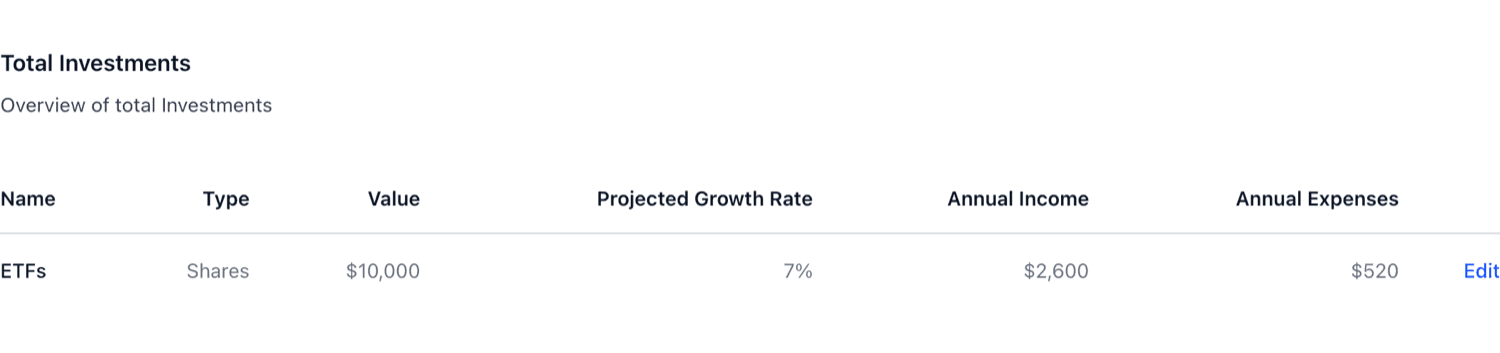
The table lists each investment with its type, current value, projected growth rate, annual income (such as dividends or distributions) and annual expenses (such as fund or platform fees). Click an investment's name to open it.
Seeing what drives an investment's value
An investment's Overview tab charts its value over time. The chart splits the value into three parts: the initial investment, the contributions you add, and growth (returns).
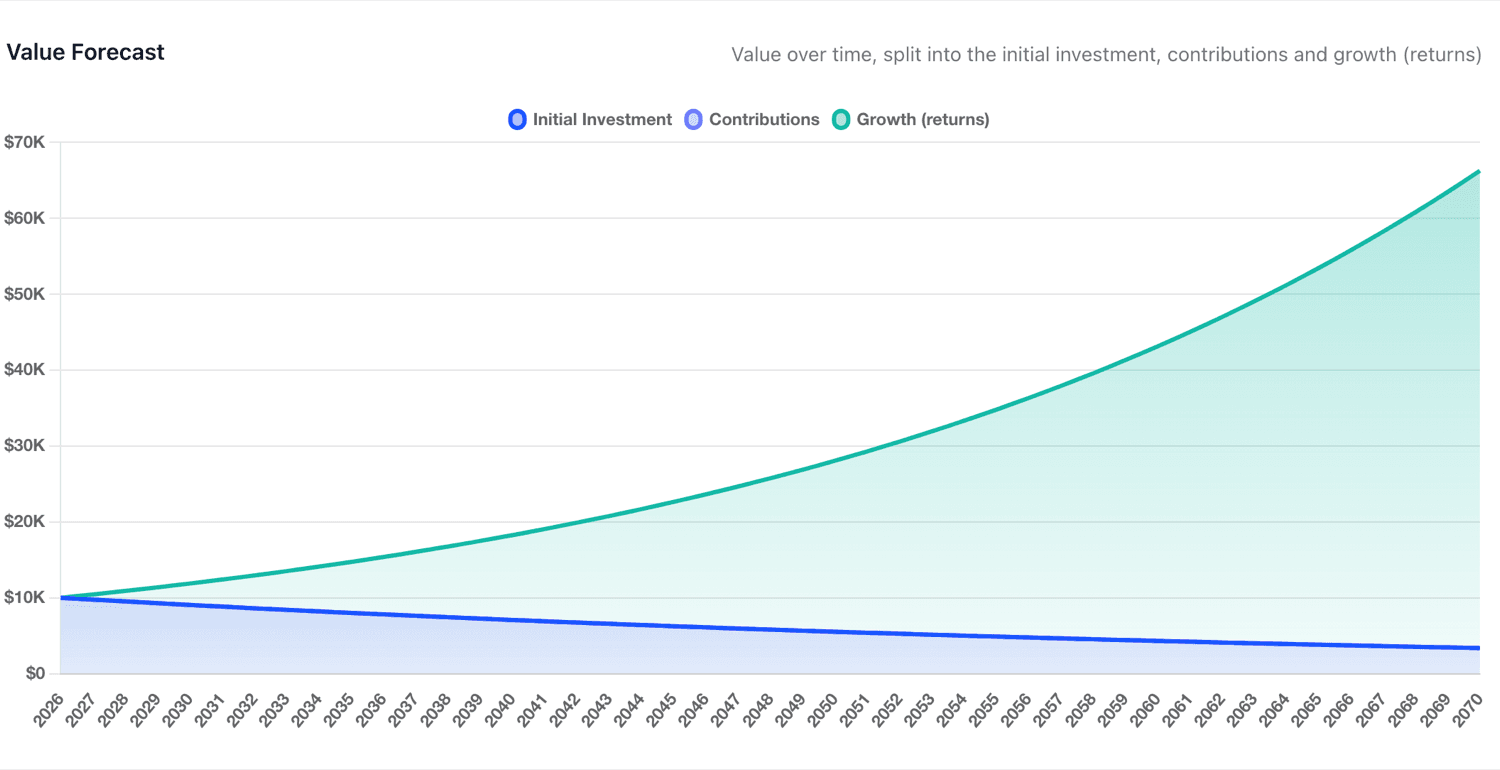
Below the chart, a summary shows the value at the end of the projection and what share comes from each part. Over long periods, growth usually ends up being most of the value, which is compound interest at work.

Adding or editing an investment
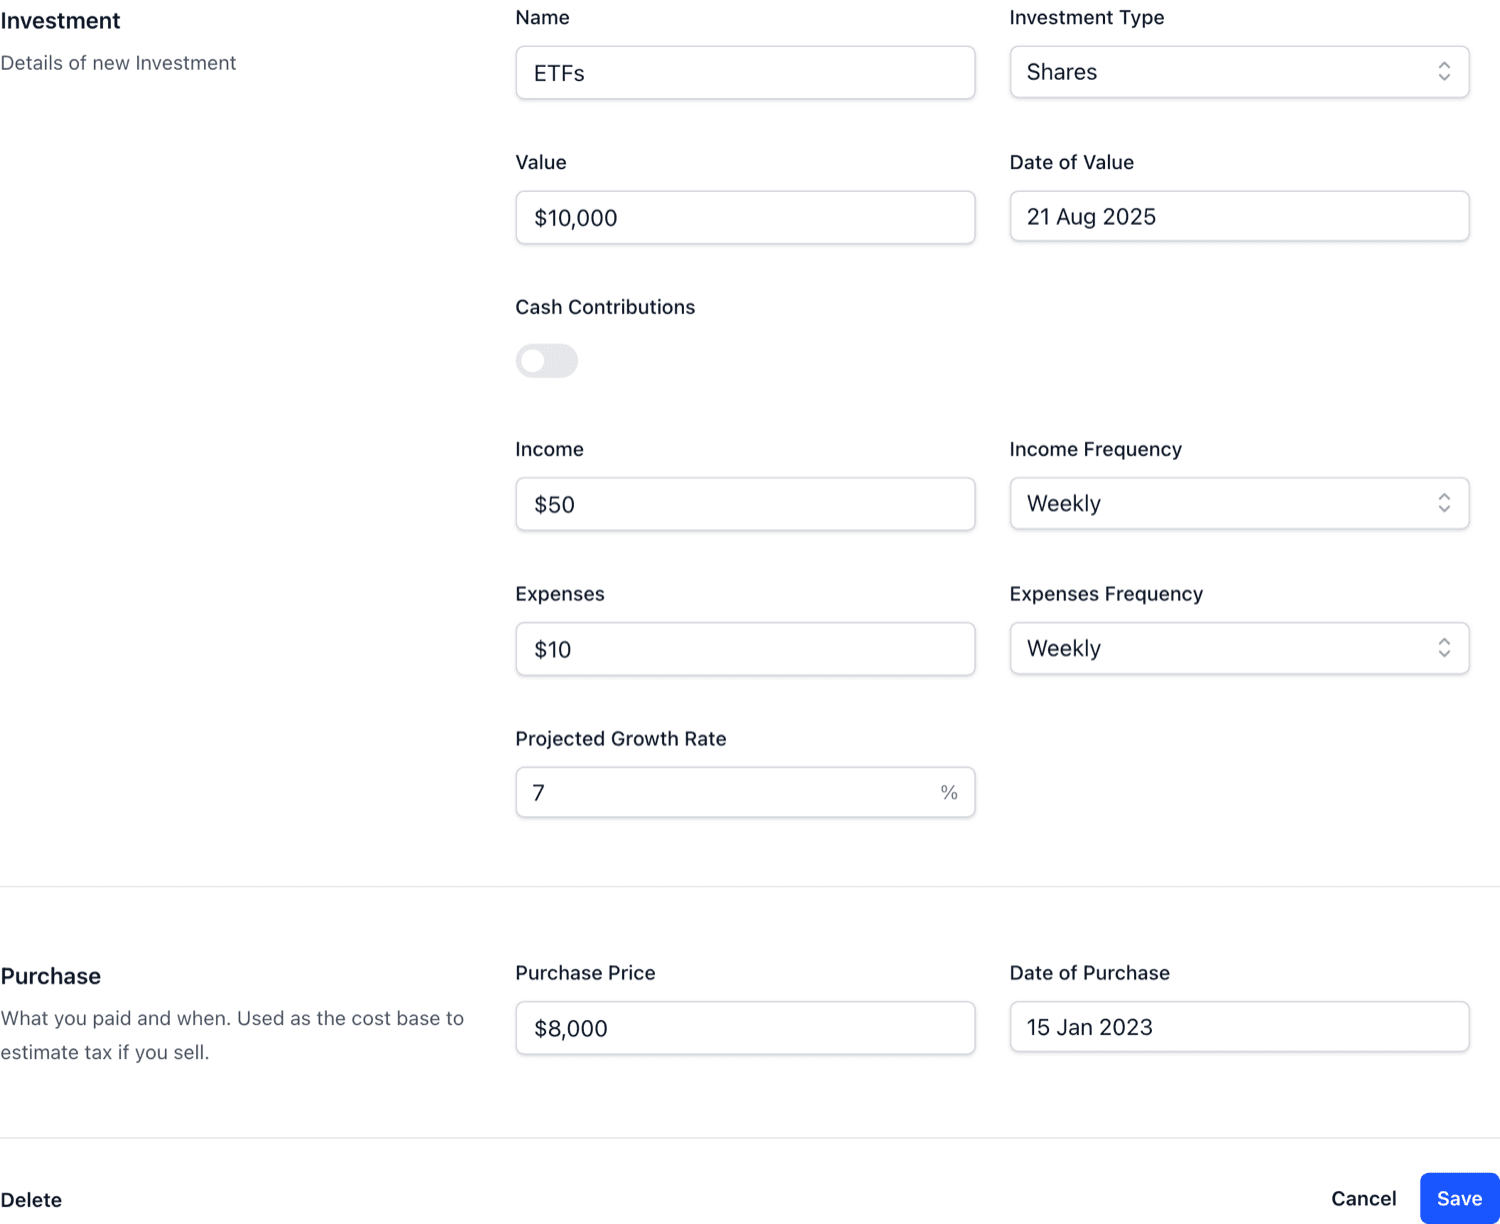
Use Add Investment on the Investments page, or the Details tab on an existing investment. The fields are:
Name and Investment Type - how the investment appears in tables and charts.
Value and Date of Value - what it's worth and when you checked.
Cash Contributions - money you add regularly, for example through a monthly investment plan. Regular contributions like this are often called dollar-cost averaging.
Income and Expenses, each with a frequency - dividends or distributions coming in, and fees going out.
Projected Growth Rate - the yearly return you expect, before inflation.
Purchase Price and Date of Purchase - what you paid. Calm Sea uses this as the cost base to estimate tax if you sell.
Planning a sale
The Sell Details tab lets you plan to sell an investment in a future year. It stays in your portfolio and is marked as sold, so your projections show the proceeds instead of the holding from that point.

Investments are one of the assets your retirement plan can draw from. The Plan guide shows how to set the order Calm Sea draws on them once you retire.