Liabilities: a complete walkthrough
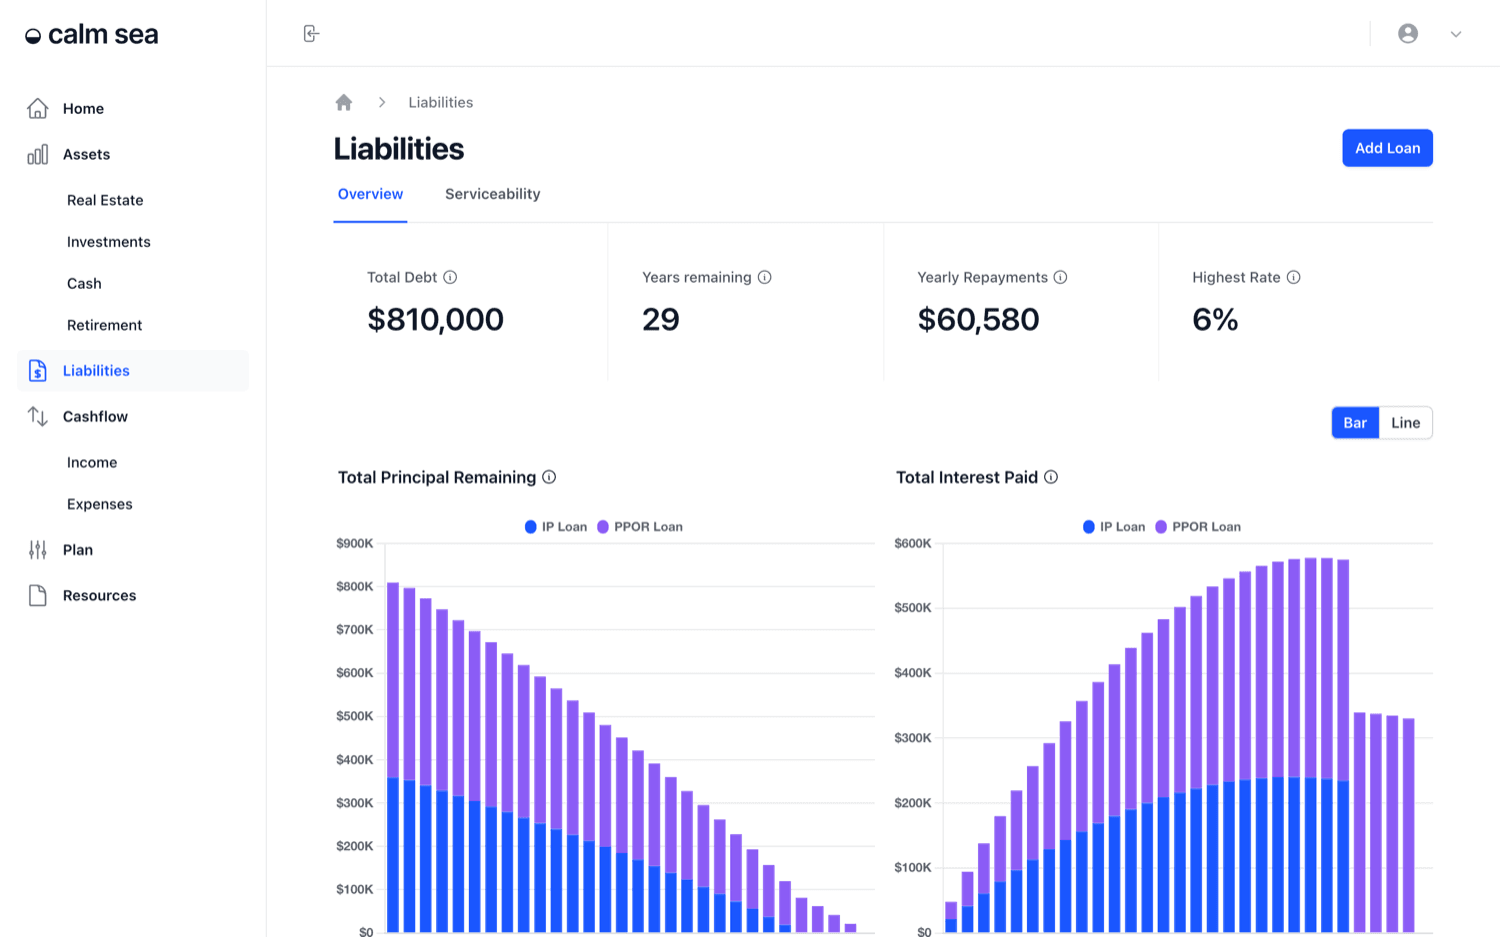
The Liabilities section covers everything you owe: mortgages, investment property loans, car loans and other debts. It shows how much you owe today, how quickly it's being paid down, how much interest it will cost, and how your repayments compare with your income.
What you'll be able to do: By the end of this guide, you'll know how to read your debt summary, test a different interest rate, check serviceability, and add a loan linked to the asset it pays for.
Finding the Liabilities page
Open Liabilities in the sidebar. The page has two tabs, Overview and Serviceability.
Reading the summary cards
Total Debt - the combined outstanding balance of every loan.
Years remaining - how long until the last loan is paid off at its current repayments.
Yearly Repayments - the total you repay across all loans in a year.
Highest Rate - the highest interest rate among your loans. It's a quick pointer to which debt costs you the most.
Reading the principal and interest charts
Total Principal Remaining shows each loan's balance falling year by year until it's cleared. Total Interest Paid shows the interest cost building up over the life of the loans. Use the Bar and Line toggle to switch chart styles.
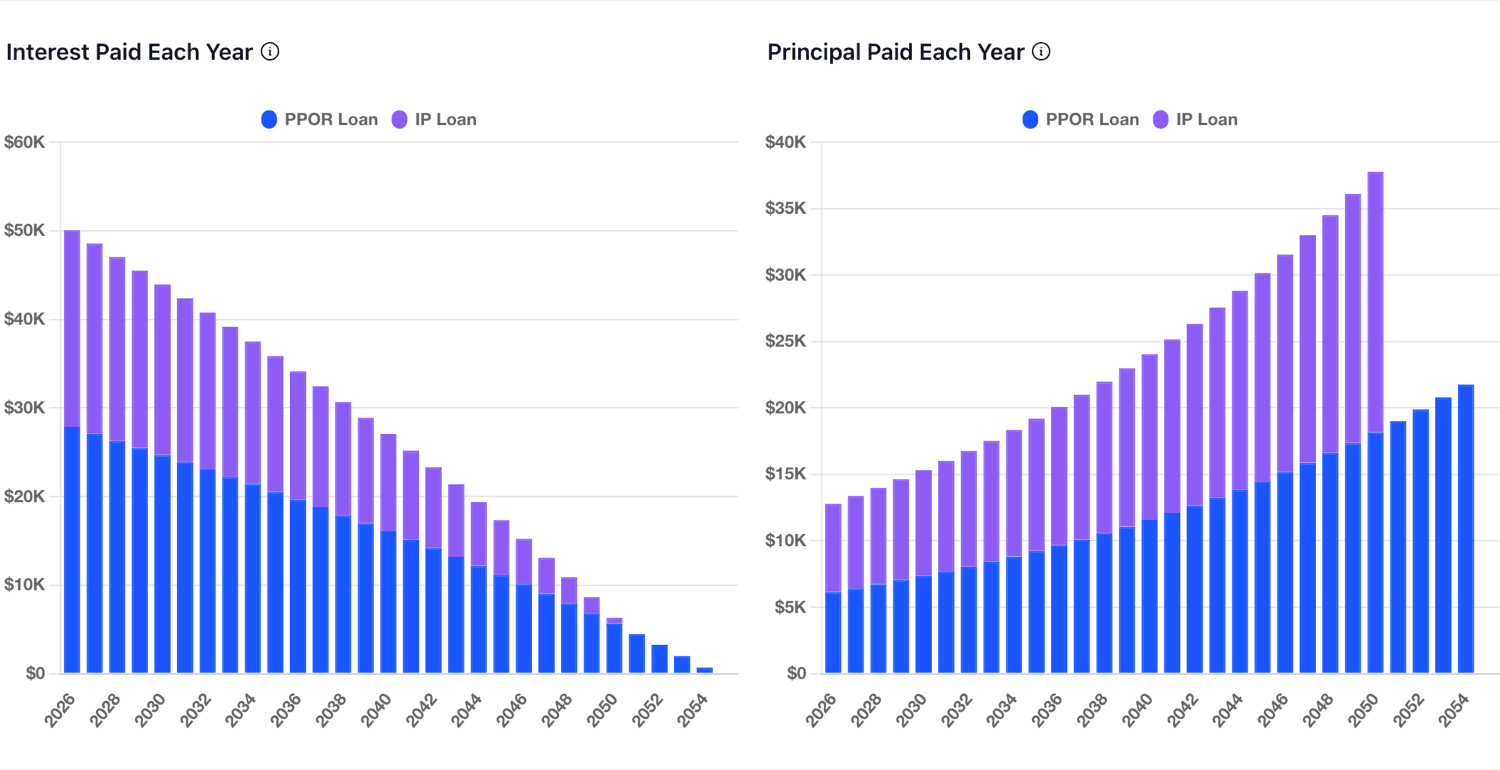
Further down, Interest Paid Each Year and Principal Paid Each Year show how each repayment is split. Early on, most of a repayment is interest. Towards the end of the loan, most of it is principal.
Testing a different interest rate
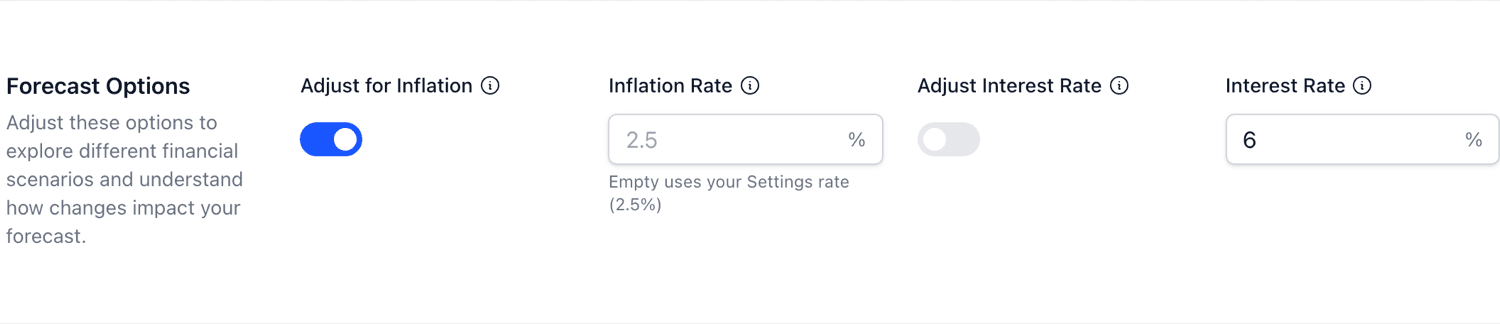
Forecast Options on this page adds Adjust Interest Rate. Turn it on and enter a rate to see what your repayments, interest and payoff dates would look like if rates moved. Your saved loans don't change. Adjust for Inflation and Inflation Rate work the same way as on other pages. The interest rate guide explains how rates affect a loan's total cost.
Using the Total Loans table
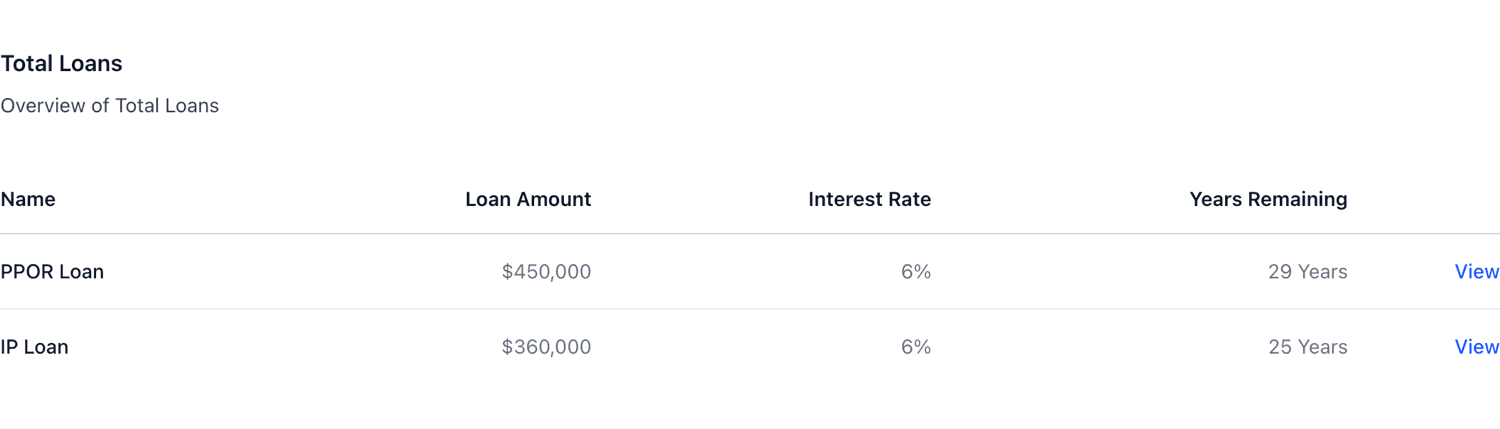
The table lists each loan with its amount, interest rate and years remaining. Click View to open a loan.
Checking serviceability
The Serviceability tab compares your loan repayments with your gross income each year:
Repayments to Income - repayments as a percentage of gross income.
Lending Limit - the repayments-to-income ratio used as a cap.
Gross Income - your income before tax for the year.
Borrowing Capacity - roughly how much more you could borrow before hitting the lending limit.
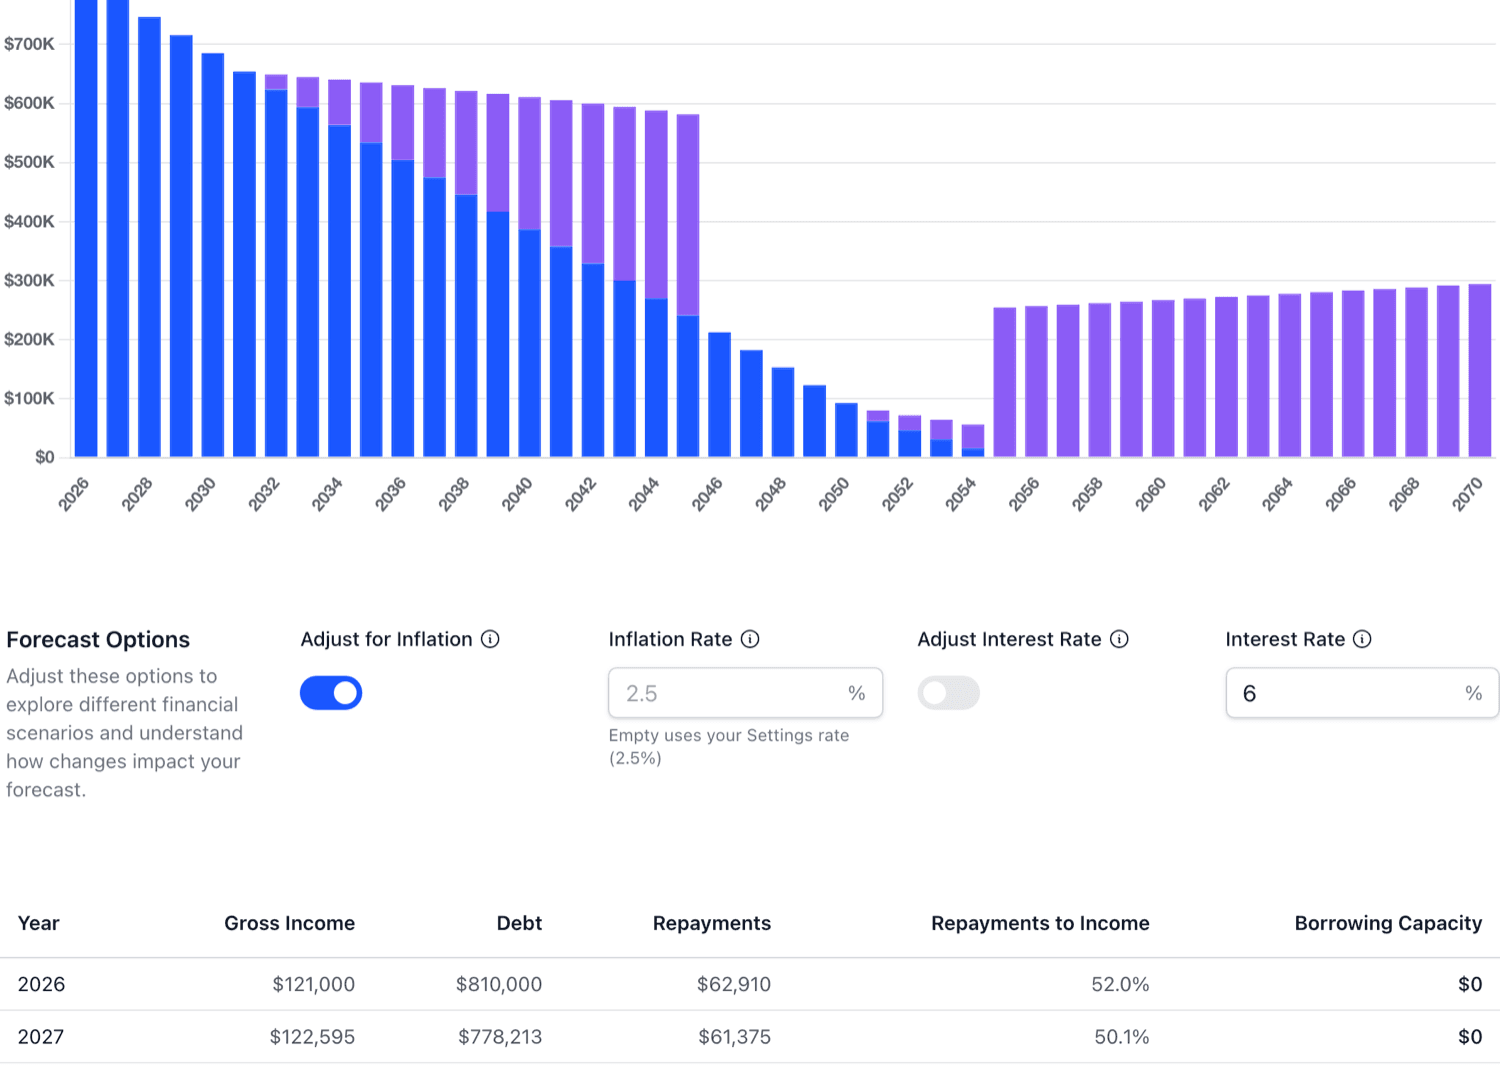
The chart and the yearly table show how your borrowing capacity changes as loans are paid down and income grows. It's an estimate to help you plan, not a lender's assessment.
Opening a single loan
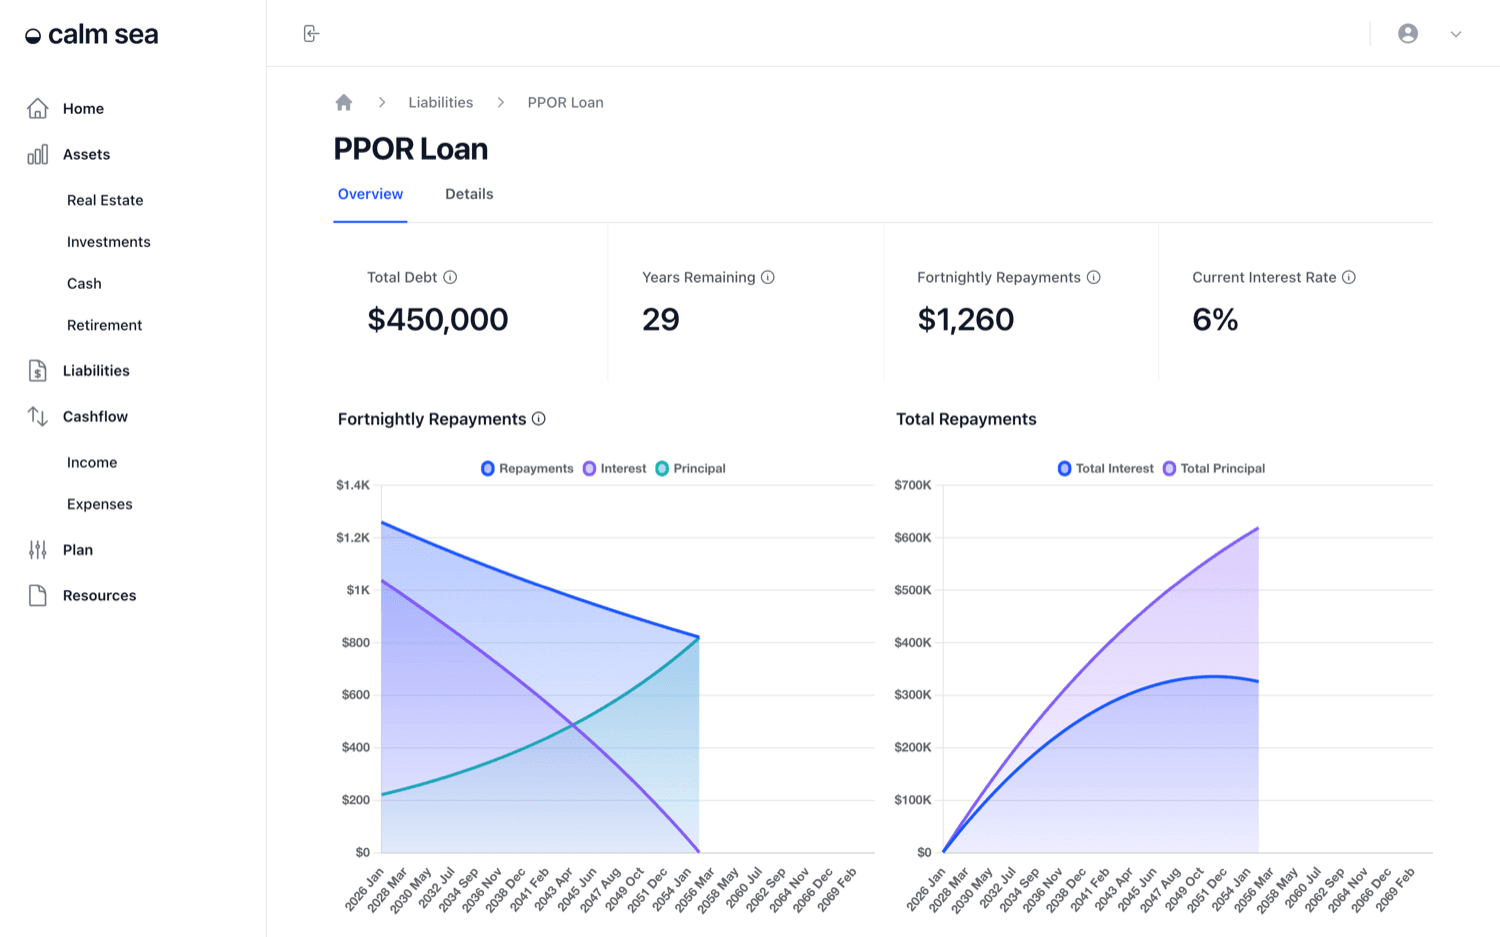
A loan's Overview tab shows its balance, years remaining, repayments at the loan's own repayment frequency and its current rate, with charts of repayments and total repayments over time.
Adding or editing a loan
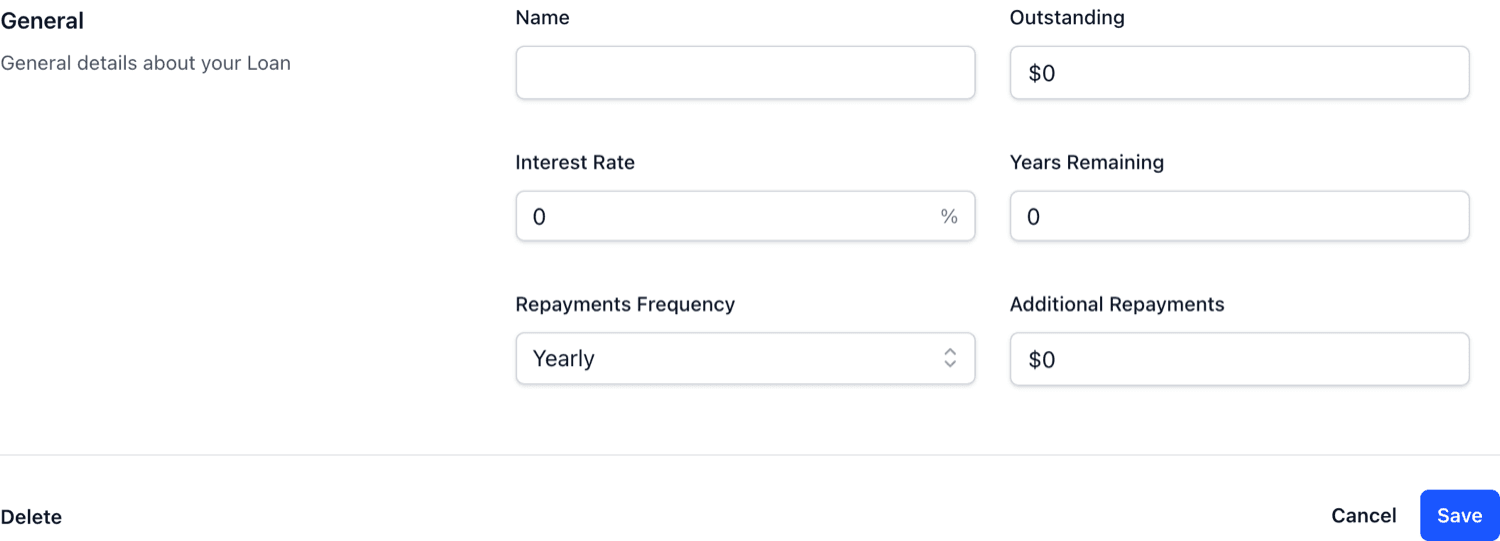
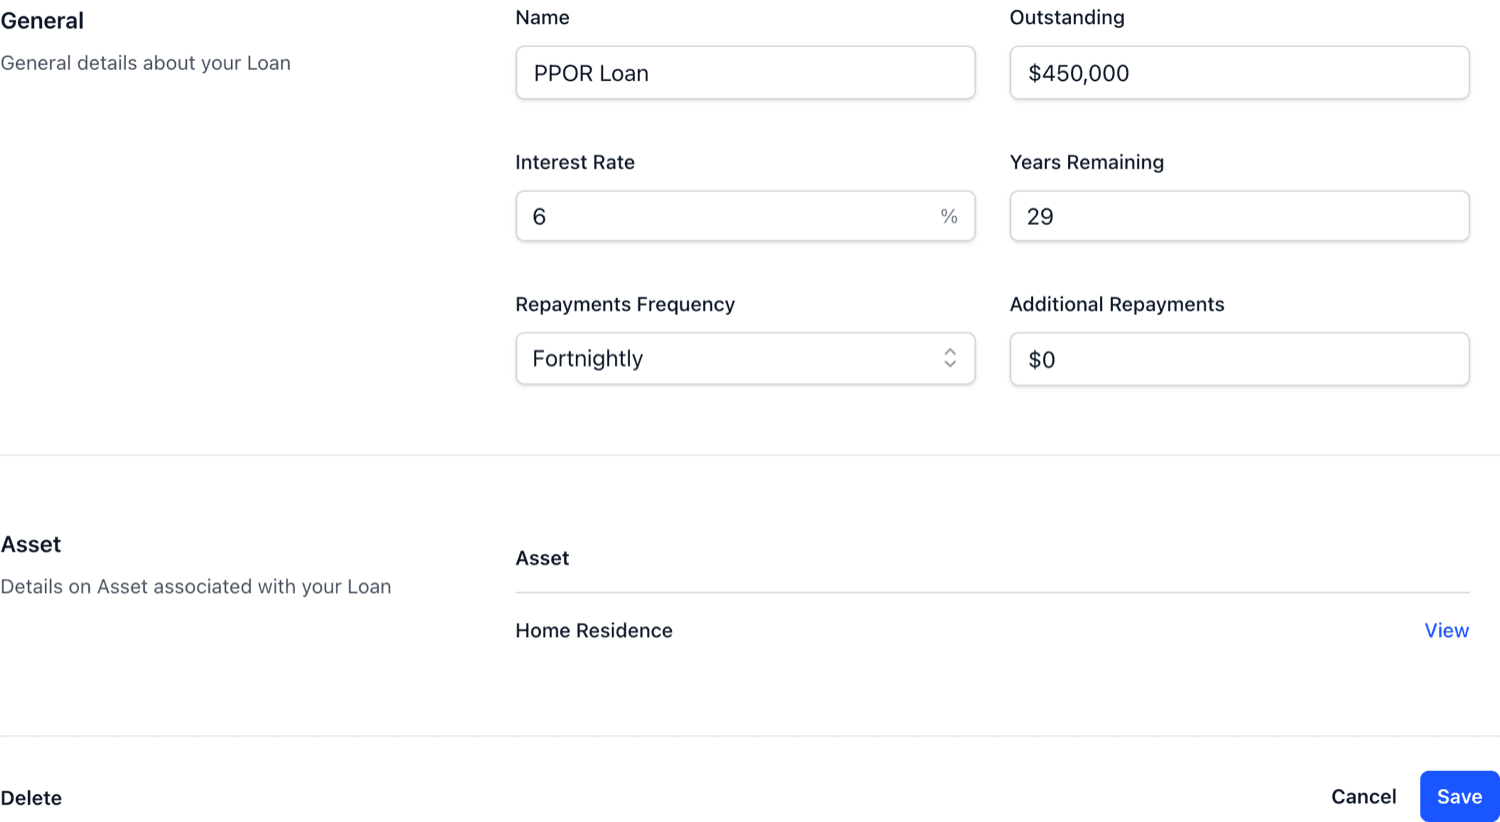
Use Add Loan on the Liabilities page, or a loan's Details tab. Enter the Name, Outstanding balance, Interest Rate, Years Remaining and Repayments Frequency. Additional Repayments lets you model paying extra. Even small extra repayments can take years off a loan.
A loan's Details tab also shows the Asset it's linked to. Link loans from the property's Details tab, as covered in the Real Estate guide. A linked loan counts towards that property's equity and LVR.
Loan repayments also flow into your yearly budget. The Cashflow guide shows where they appear.