Your Home Dashboard: a complete walkthrough
Everything you need to know to navigate, read, and act on the information you see the moment you log in.
What you'll be able to do: By the end of this guide, you'll know how to read every section of the Home Dashboard, understand what information you can get out from each section and how to use the quick shortcuts.
Finding your way to the dashboard
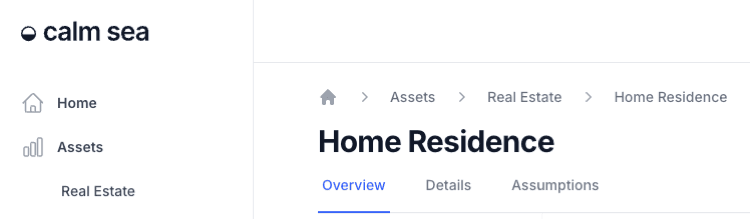
The Home Dashboard can be easily accessible from anywhere on the website by clicking the Home Icon in the the top left side bar or clicking the Home Icon in the Page Breadcrumbs.
Reading the Summary Cards
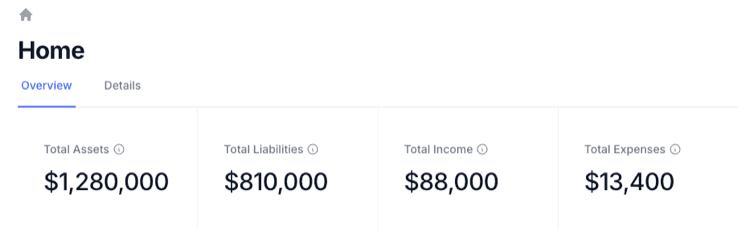
At the top of the Home Dashboard, four summary cards show some important metrics.
Total Assets - This is the accumulative sum of all your assets
Total Liabilities - This the accumulative sum of all your debt
Total Income - This is the accumulative sum of all your income
Total Expenses - This is the accumulative sum of all your yearly allocated expenses
Exploring the Overview Charts
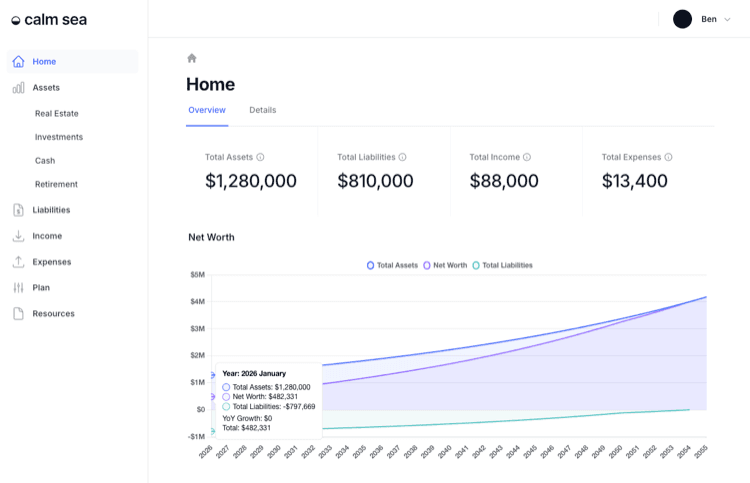
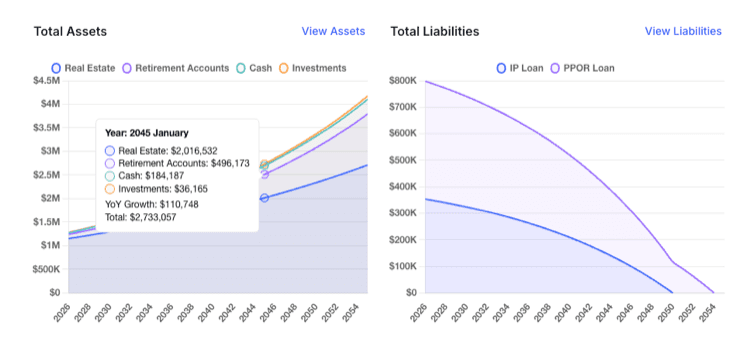
In the Overview Tab, you get a projection of the accumulative sum of all your Net Worth (Assets - Liabilities), Assets, Liabilities, Income and Expenses. This uses all your inputted data such as total shares, property value, mortgages, projected growth rates, projected average inflation just to name a few!
Each chart has a hover tooltip to showcase the projected value at that specific point in time as well as a shortcut to the breakdown page of each data type
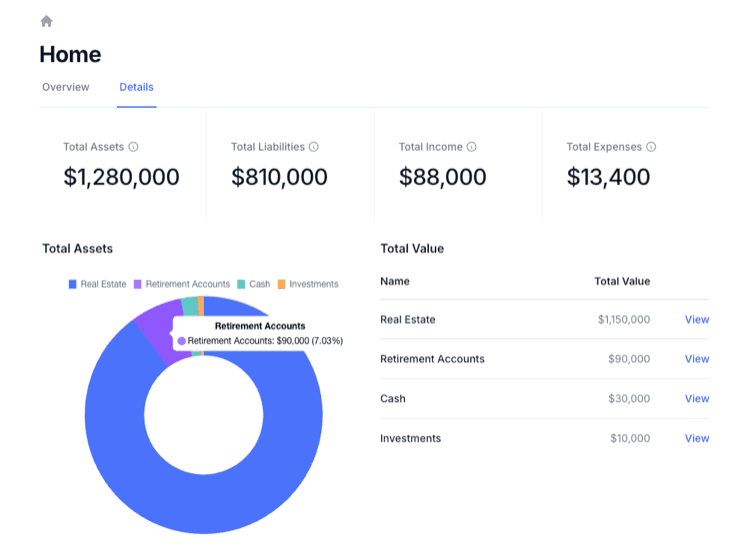
Because everyone's situation and approach is unique, there is a Details Tab which lets you visualize the breakdown of the data, presenting it as a pie chart and table. This lets you see the information from a different angle and lets you drill down into lower categories.