Assets Dashboards: a complete walkthrough
Everything you need to know to navigate the Assets Dashboards and how they interact with other accounts such as Liabilities.
What you'll be able to do: By the end of this guide, you'll know how to interact and interpret every section of the Assets Dashboard and how assets can evolve over time using projection modeling.
Finding your way to the dashboard
The Asset Dashboard can be easily accessible from anywhere on the website by clicking the second item in the Side Bar.
Understanding the Assets Dashboard Summary
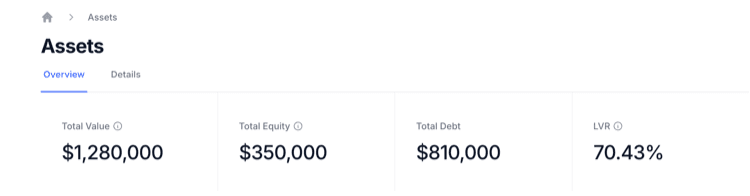
At the top of the Assets Dashboard, four summary cards show some important metrics.
Total Value - This is the accumulative sum of all your assets
Total Equity - This the accumulative sum of all your assets minus the accumulative sum of all your Liabilities
Total Debt - This is the accumulative sum of all your Liabilities
LVR - This stands for Loan-to-Value Ratio is a percentage figure to compare the size of total Liabilities against total assets
Understanding the Assets Dashboard Charts
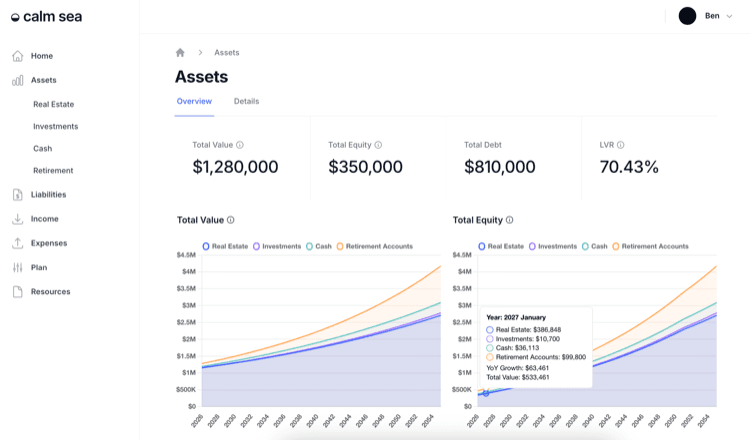
There are two charts, Total Value and Total Equity, together they provide an overview of the current make up of your assets and provides a projection model of the value and equity of theses assets over time.
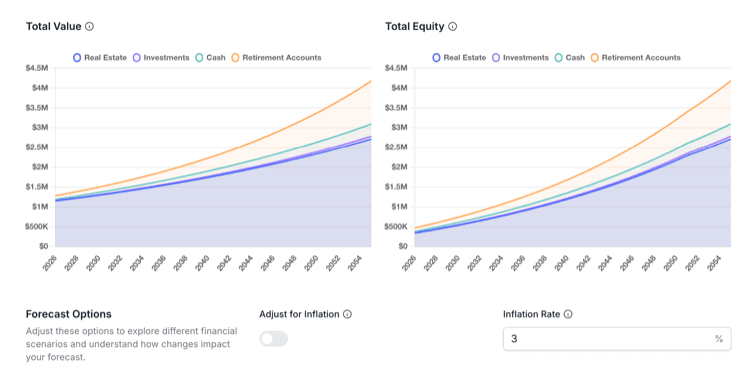
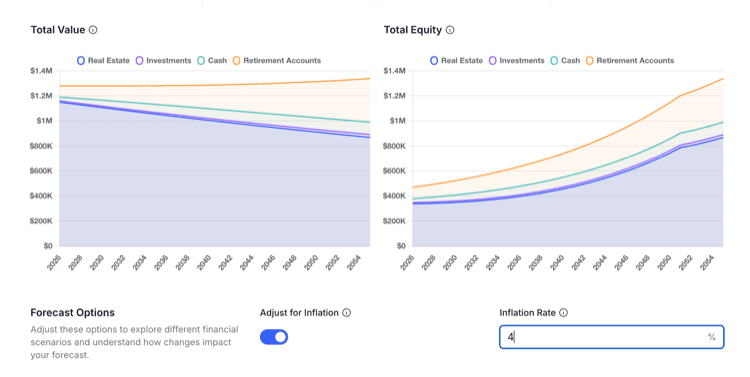
The Forecast Options provide an opportunity to recalibrate the projection models into today's present value by toggling on Adjust for Inflation. Put another way it can show the future value in today's present value.
Present Value is the current worth of a future sum of money or stream of cash flows, based on a specific rate of return (the discount rate).
An example of this is if you assume you have an asset that is worth $100 that grows in value at 3% per annum, but inflation is also at 3% per annum. Then 1 year, though the asset will be worth $103 in future value, it will be $100 in Present Value.
The input field Inflation Rate allows you to alter the projected average inflation rate and see the impact it has on the value of your assets. Using this feature you are able to see how if the growth rate of the asset does not keep up with the inflation rate, the value of the asset in today's Present Value will decrease.
Understanding the Total Assets Table
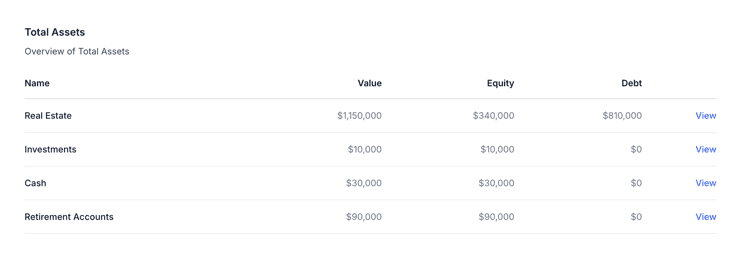
As powerful as charts can be at presenting meaningful information, sometimes you just want to see data in a table. The table section allows you to see the assets broken down into categories, see any liabilities associated and the ability to drill down into the Asset Categories via the View link.
Understanding Assets Details
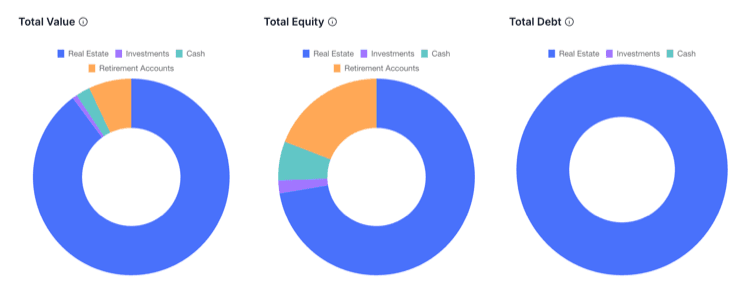
The Details Section provides a cross section of the current breakdown of assets and their associated equity and liabilities. This representation is portrayed as Doughnut Charts showing the percentages of each category and gives you another opportunity to drill down into more detail by clicking on each chart section.